

- Dashboards:
- The DORA Dashboard gives clear insights into how fast, reliable, and efficient your development practices are.
- The Velocity Dashboard visualizes your team’s success across the SDLC.
- The AI impact for GitHub Copilot Dashboard provides insight into Copilot adoption and engagement across your engineering teams.
- Custom Dashboards allow you to create shared views of the key engineering metrics that matter most to your organization
- Data Explorer - Analyze trends over time and drill into the underlying data for investigation. Explore metrics for deploys, version control, project management (Jira), and incident management (PagerDuty).
- All Metrics (Legacy View) - Aggregates data from your connected entities to calculate critical metrics based on your organization’s priorities.
- Custom metrics - Define your own custom metrics to power the analytics in Eng Intelligence, drawing from your integrations with Cortex or your organization’s internal data.
Note: After completing the initial integration setup, Eng Intelligence data may take up to 24 hours to fully appear as Cortex backfills up to six (6) months of historical data. You may see partial data during this process.
Measuring success with Eng Intelligence in Cortex
In practice, success means that teams are not only tracking metrics like cycle time, deployment frequency, change failure rate, and mean time to recovery (MTTR), but they are also taking action to make progress based on how the metrics are trending. The focus should be less about hitting specific benchmarks and more about creating continuous feedback loops that drive consistent improvement.Eng Intelligence goals
Eng Intelligence metrics provide clear, actionable insights into how your teams work, allowing you to find opportunities to improve delivery speed, reliability, and quality. Before setting goals, it’s recommended to establish a baseline on your top-priority metrics.Early signs of improvement
Leading indicators show that teams are learning from Eng Intelligence metrics and effectively making changes in their day-to-day work. For example:- Faster feedback loops - Time to first PR review, Time to PR approval, and Work item lead time steadily decrease over a given period, meaning code is moving through review faster and engineers are spending less time waiting.
- Smaller, more frequent PRs - PR size trends downward while merged PR count increases, a sign that teams are breaking work into more reviewable, lower-risk chunks.
- Balanced workloads - More unique PR authors over time reflects distributed contribution rather than a few engineers carrying the load. For project management, a healthy balance of work items created and work items completed indicates the team is managing capacity effectively.
- Proactive incident management - Change failure rates decrease as teams integrate deploy insights into their release practices, catching issues earlier before they reach production.
Outcomes of improvement
Lagging indicators can measure whether your organization is seeing tangible improvements in delivery and reliability. For example:- Cycle time improves from baseline
- Deployment frequency increases without increased failure rates
- MTTR decreases after incidents
- Higher engineering satisfaction is reported in internal surveys as bottlenecks are resolved
- The backlog of work items created stabilizes or decreases while work items are steadily being completed, indicating the team is successfully matching capacity to demand
Best practices for reviewing Eng Intelligence metric trends
It’s recommended to follow these best practices when reviewing metric trends:- Segment by teams and services to avoid skewed organization-wide averages
- Look for trends rather than snapshots. Success is measured over time; a short-term fluctuation can be misleading.
- When you identify process gaps with Eng Intelligence, take action to drive adoption of standards:
- Use Scorecards or Initiatives to encourage your teams to get their owned services aligned with standards.
- Use Workflows to streamline repeatable tasks for engineers so they can focus on other work.
Defining success
The following are common ways to confirm successful use of Eng Intelligence features:- Leadership uses the dashboards to make strategic decisions (e.g. during planning cycles)
- Teams are actively using the dashboards to spot bottlenecks
- Metrics drive measurable changes in process, tooling, and culture
- Improvements are sustained and repeatable, not just short-term spikes
Accessing Eng Intelligence
Prerequisites
- Users with the
View Eng Intelligencepermission can view Eng Intelligence. - Users with the
Configure Eng Intelligencepermission can configure Eng Intelligence settings. - Before using Eng Intelligence, configure your version control providers, PagerDuty, and Jira with the required permissions. See the integration documentation for details.
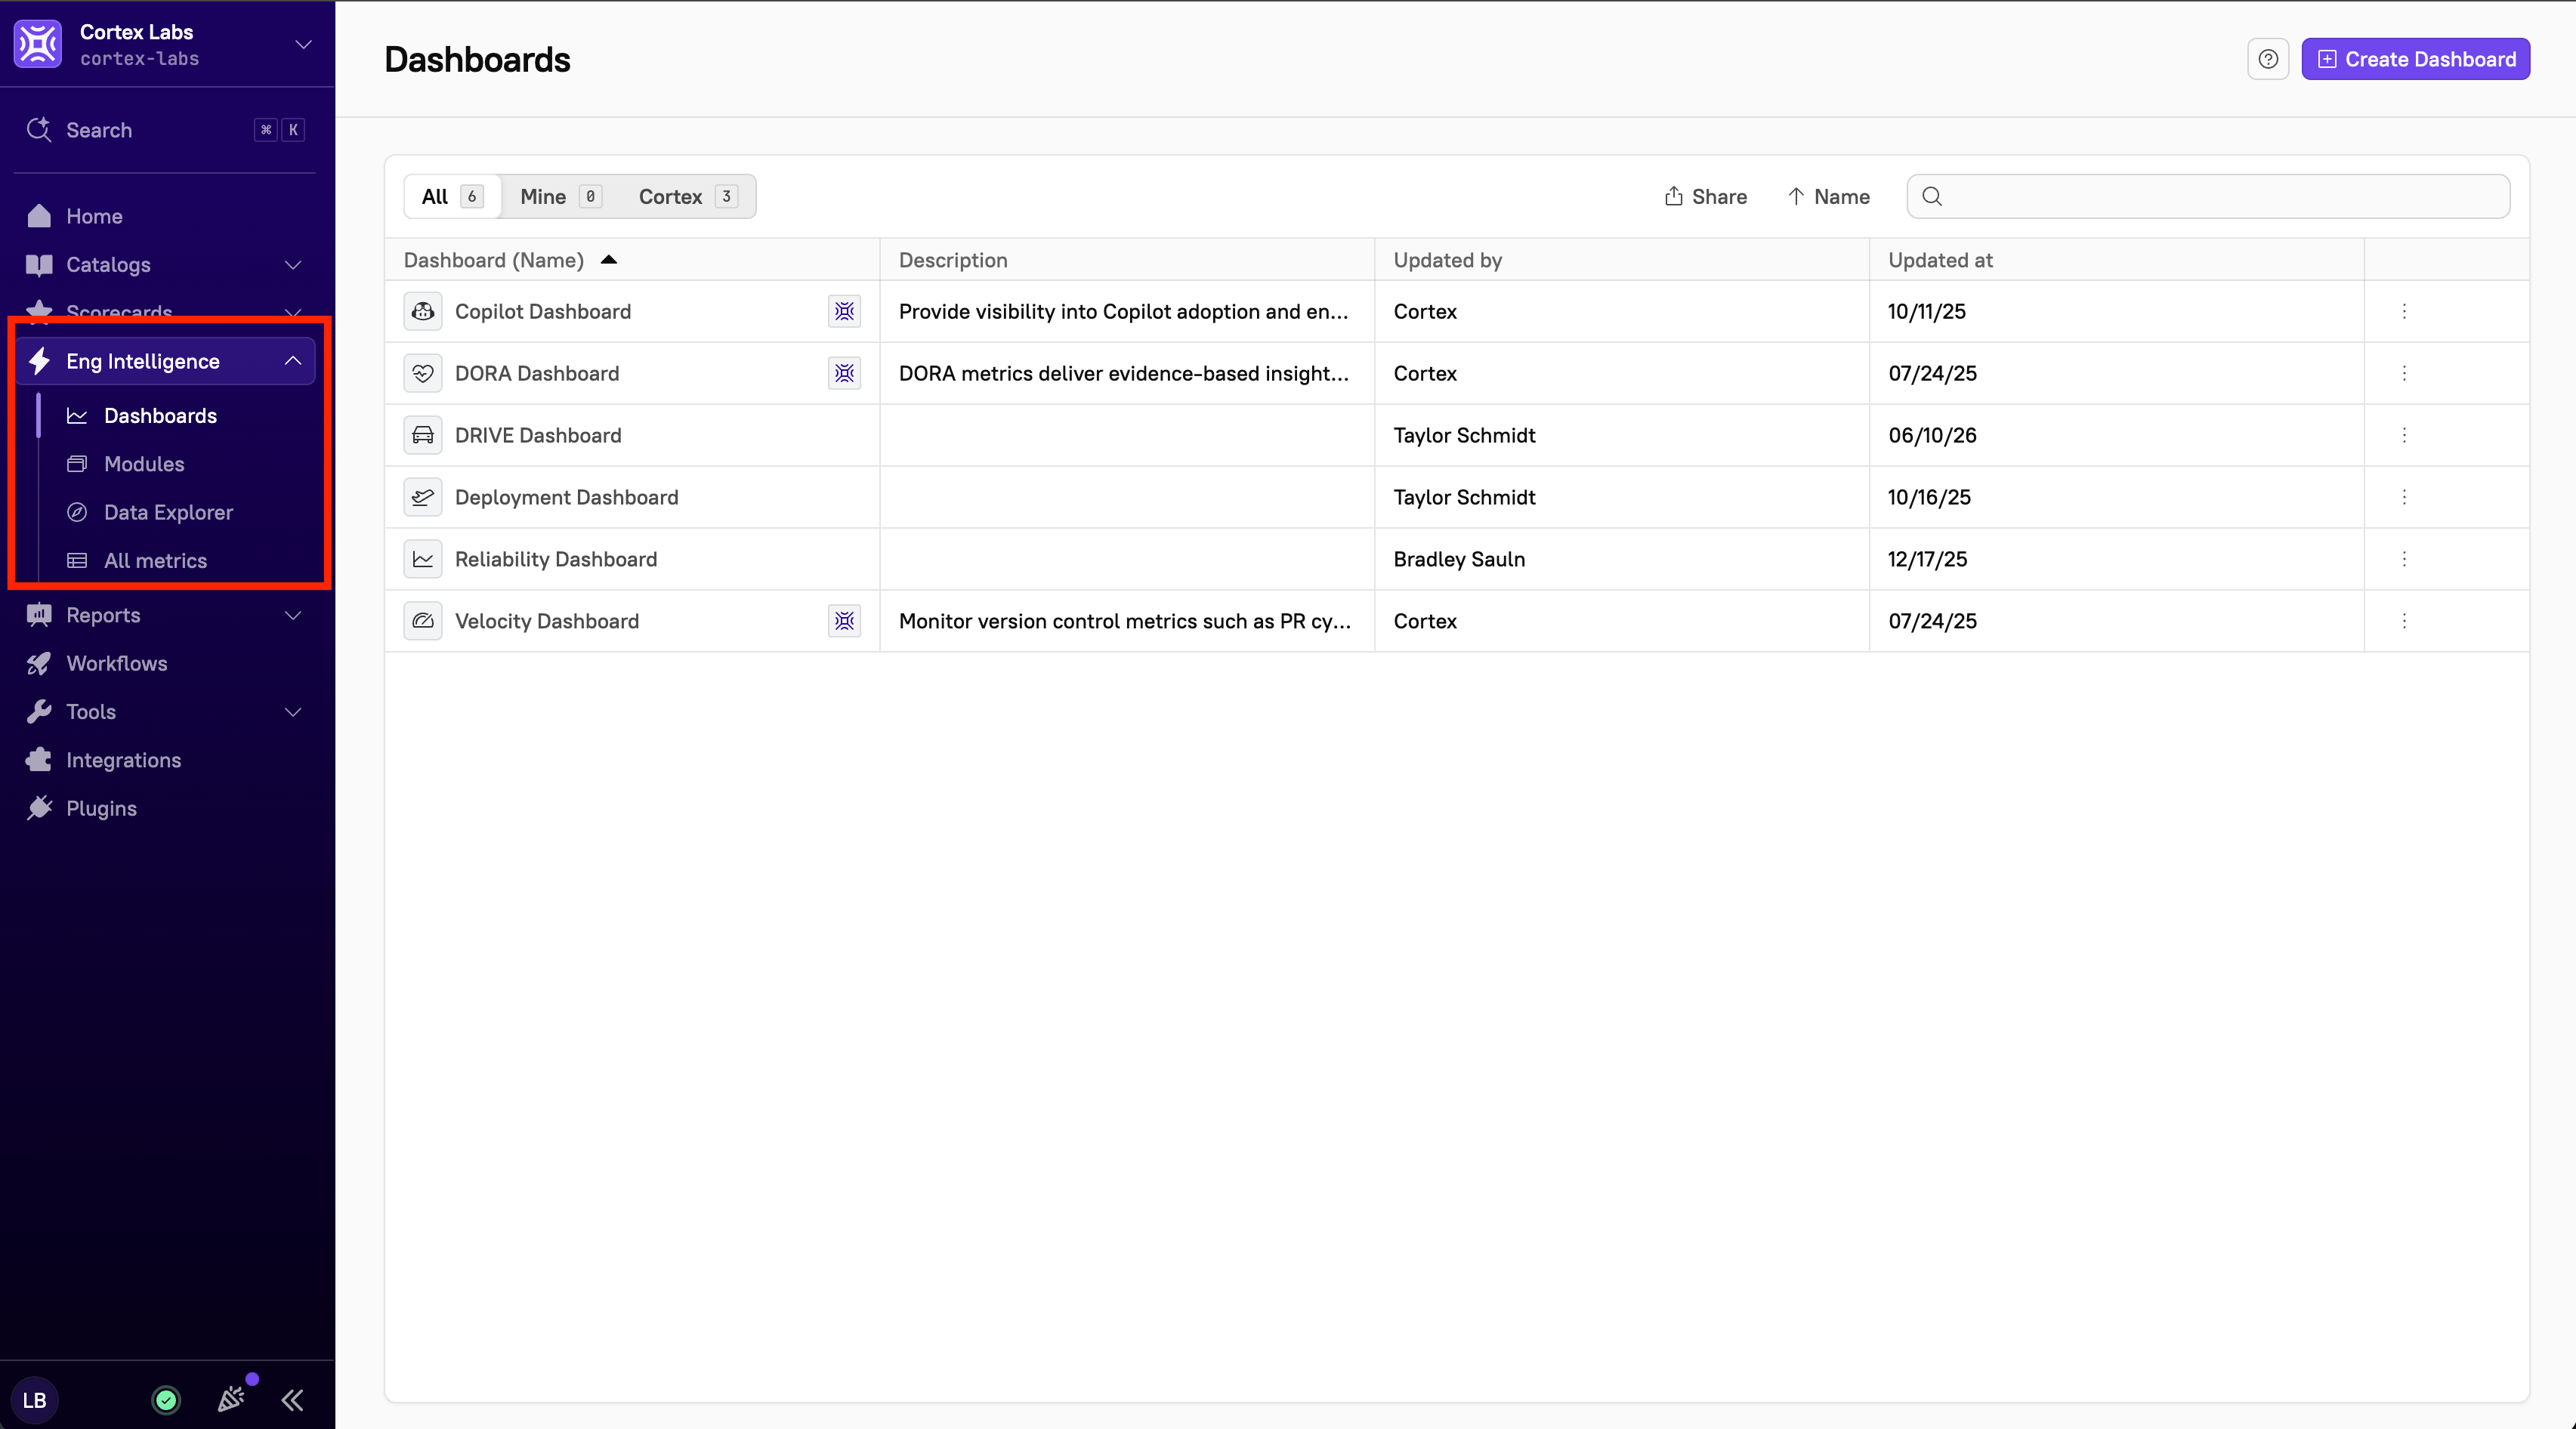
- From the main sidebar, expand Eng Intelligence, then select one of the following:
- Dashboards
- Modules
- Data Explorer
- All Metrics
BitBucket and Eng Intelligence
- Due to rate limits, Bitbucket ingestion in Eng Intelligence is limited to repositories mapped to a Cortex entity.
- When using Bitbucket in Eng Intelligence, it’s highly recommended to use the workspace token configuration.