

The AI Dashboard is in Private Beta for select cloud customers. If it isn’t enabled for your workspace, you have the Copilot Dashboard, which is in Public Beta. See Copilot Dashboard (Public Beta).
Prerequisites
Before getting started:- You must have the GitHub integration configured. See instructions below for each integration method:
- Cortex GitHub app
- If configured before October 14, 2025, you must re-authorize your Cortex GitHub app to accept two new permissions.
- Custom GitHub App
- Add the following permission to your custom GitHub App:
admin:org read
- Add the following permission to your custom GitHub App:
- Personal Access Token
- Add the following permission to your PAT:
admin:org read
- Add the following permission to your PAT:
- Cortex GitHub app
Copilot usage history can’t be backfilled. The dashboard populates over time as usage data is collected.
What GitHub Copilot data appears in the dashboard
The following data appears on the Impact and Adoption tabs:- Impact tab - The Regular AI users vs No AI chart compares a delivery metric between developers in the GitHub Copilot only group (developers who used only GitHub Copilot on at least 25% of the days in each time window) and developers who don’t use AI. Developers who regularly use both GitHub Copilot and Claude Code appear in the Multiple AI tools group. The Adoption rate by team chart plots each team’s adoption rate against a delivery metric. Select GitHub Copilot in the AI tool dropdown to look at Copilot alone.
- Adoption tab - The Active AI Users and AI adoption rate metrics include Copilot users, and the AI adoption across users and Team-level AI adoption charts show the GitHub Copilot only group.
What isn’t available with GitHub Copilot
Cortex doesn’t pull Copilot spend, tokens, or session activity yet, so these parts of the dashboard need Claude Code:- The Spend tab.
- The AI sessions, AI-created pull requests, AI-created commits, AI lines added, and AI lines removed metrics on the Adoption tab.
Copilot Dashboard (Public Beta)
The Copilot Dashboard is available to all cloud customers as a Public Beta feature. You can provide us feedback here. When the AI Dashboard is enabled for your workspace, it replaces the Copilot Dashboard.
View Eng Intelligence permission can access the Copilot Dashboard.
The Copilot Dashboard provides insight into Copilot adoption and engagement across your engineering teams, including visualizations for:
- Impact by team AI adoption rate
- Correlate team adoption rate to delivery and reliability metrics. Adoption rates are provided daily by comparing active users against Copilot seats.
- Impact of Copilot users vs. non-Copilot users
- Compare delivery and reliability side-by-side between users who leveraged AI tools within the last 7 days, and those who did not. Understand whether recent AI usage affects engineering performance.
- AI adoption trends
- View the overall trends for AI adoption across your organization.
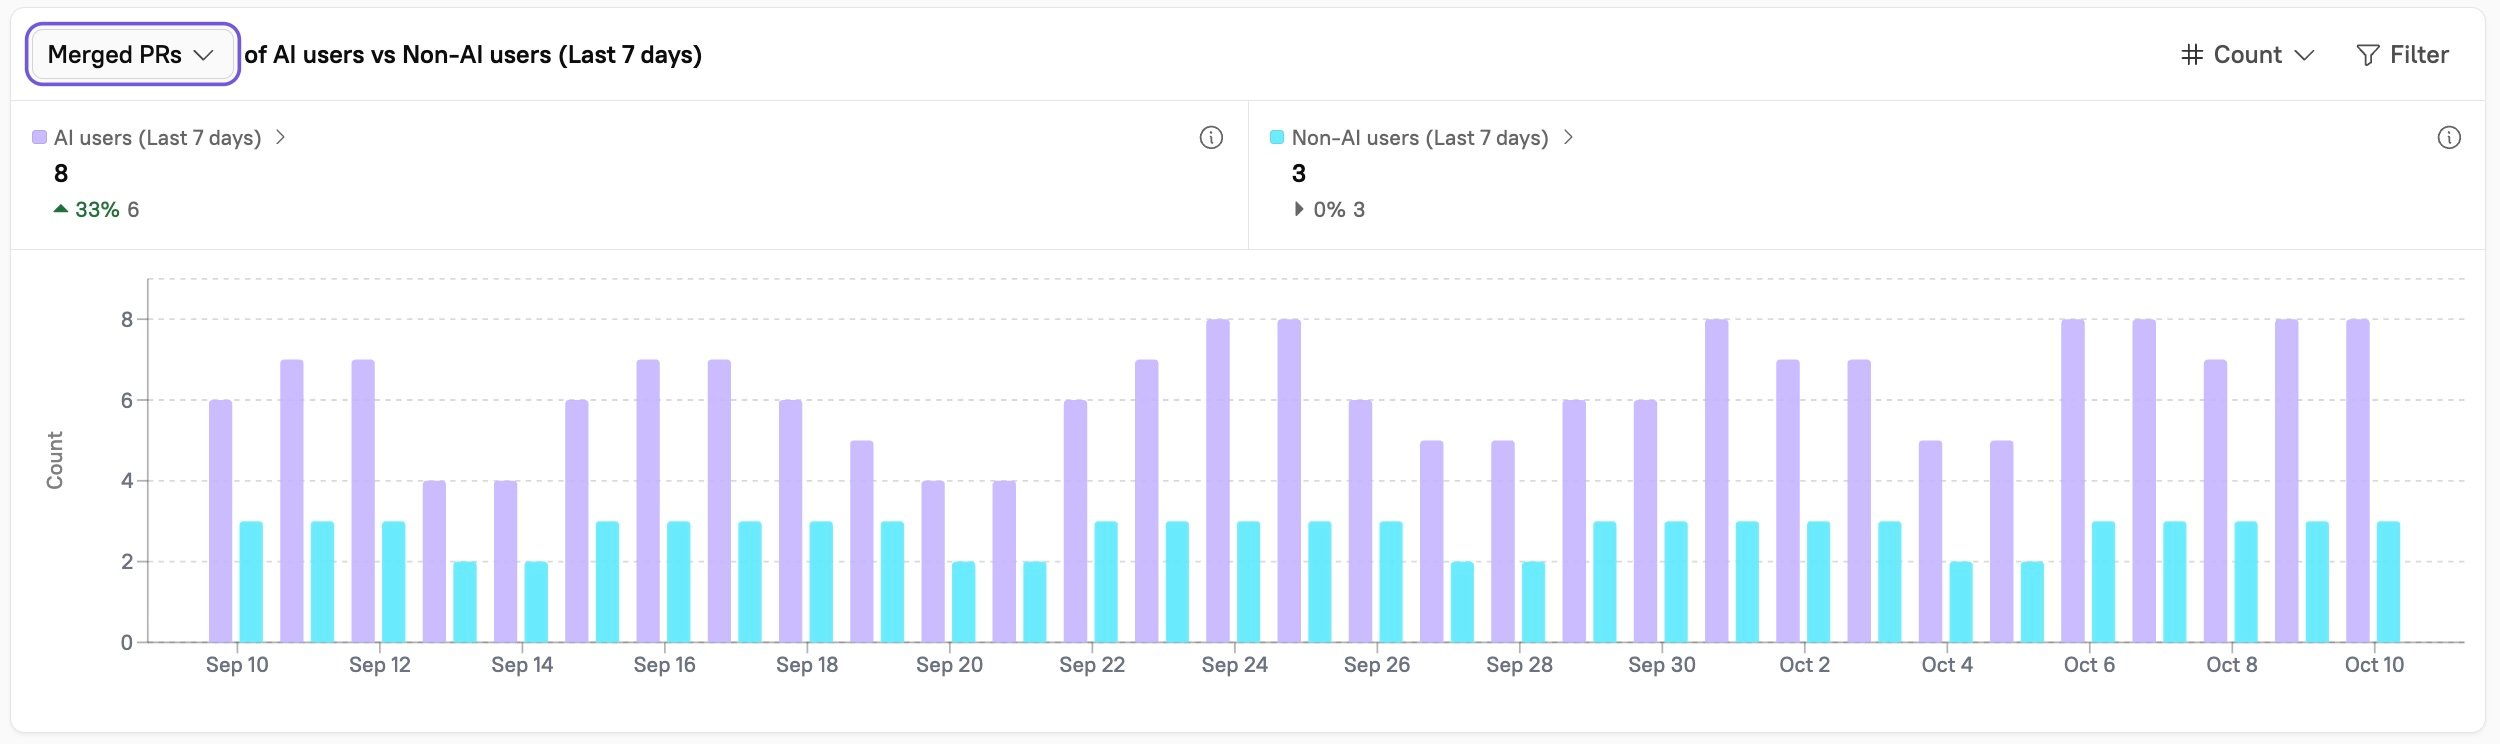
Viewing the Copilot Dashboard
Navigate to Eng Intelligence > Dashboards to see the full list of Cortex-built and Custom Dashboards available in your workspace. Click the Copilot Dashboard. This Dashboard contains multiple charts that you can filter and compare with key engineering metrics:Impact by team AI adoption rate
Impact by team AI adoption rate
View the impact that a team’s AI adoption rate has on their cycle time, deployment frequency, incident frequency, merged PRs, PR size, time to resolution, and work items completed.Hover over the data in the graph to see more information about a team and its metrics: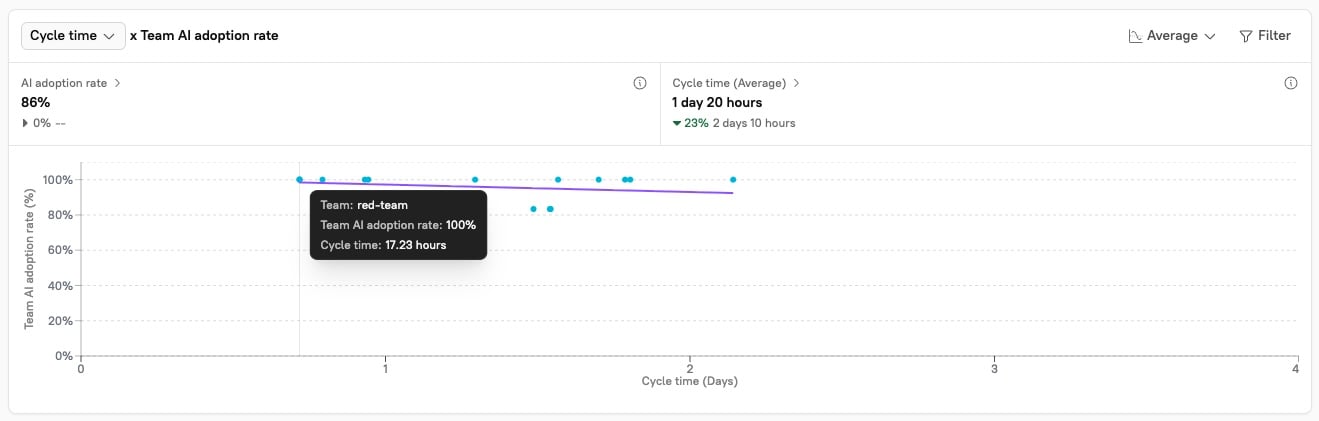
Copilot users vs. Non-Copilot users
Copilot users vs. Non-Copilot users
See the impact that using AI, or not using AI, has on cycle time, merged PRs, PR size, time to resolution, and work items completed. Cortex automatically creates an “AI Usage” user label that is attached to any team member who was active in Copilot within the last 7 days.Hover over the data in the graph to see more information about the metrics: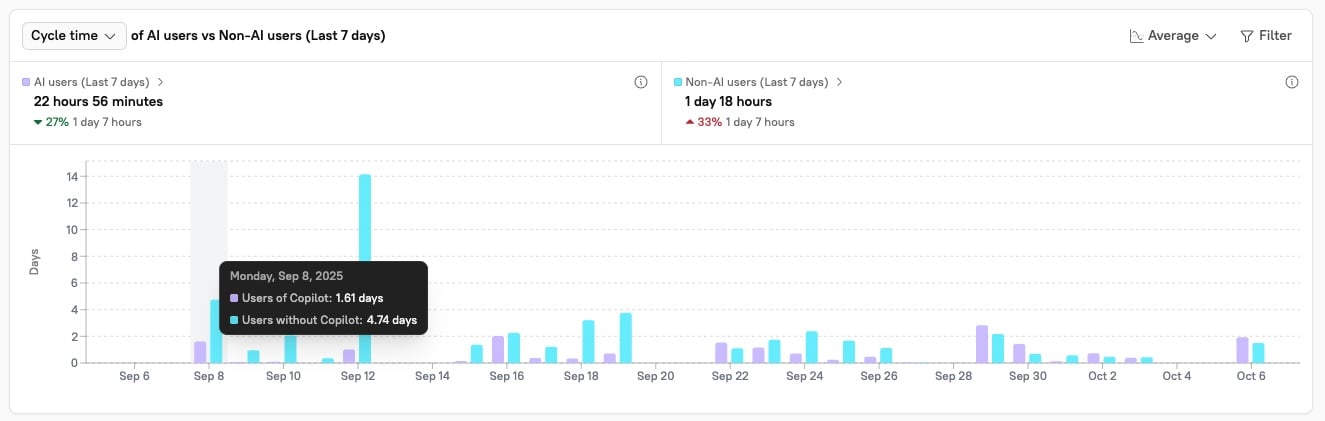
Copilot adoption over time
Copilot adoption over time
View your overall Copilot adoption metrics over time: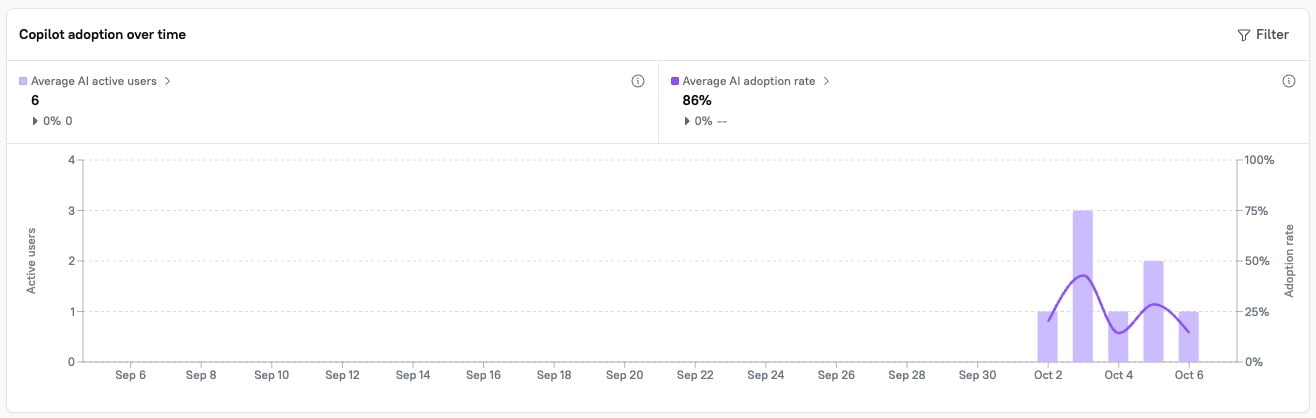
Filtering and configuring the Copilot Dashboard
Overlay a data point
To overlay a data point, click the dropdown in the upper left corner of a chart: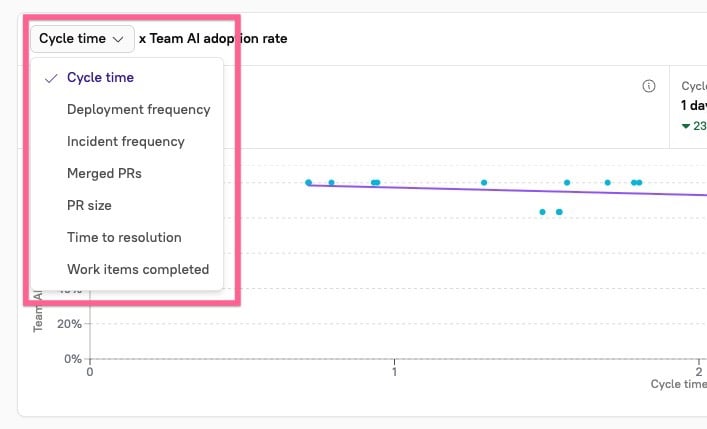
Filter the chart
You can filter at two levels:- Dashboard level - Click Filter at the top of the dashboard to apply a filter across all charts at once. The Copilot dashboard supports Domain and Team as dashboard-level filters.
- Chart level - Click Filter in the upper-right corner of an individual chart to apply filters for group, owner, repository, user label, and more. Chart-level filters override dashboard-level filters for that chart.