

- API - Post custom metric data to Cortex via the API.
- CQL - Compute data based on a CQL query that is evaluated by Cortex every 12 hours.
Use cases
Custom metrics are useful any time you have engineering data that lives outside Cortex’s built-in integrations, or when you want to derive new meaning from data that’s already there. Examples include:- Incident data from ServiceNow or other ITSM tools. Track open incident counts, MTTR, or severity trends per service. Example CQL:
custom("servicenow-incidents").length - Custom-computed SLO metrics. If your SLO calculations live in an internal system or don’t map cleanly to a native integration, push the computed values directly via API so they’re visible alongside the rest of your engineering health data.
- Metrics from homegrown tooling. Internal platforms, custom CI pipelines, or proprietary monitoring tools can all post metric data to Cortex via API, making them first-class citizens in Eng Intelligence.
- Derived metrics from existing integrations. Combine or reframe data from tools Cortex already connects to, e.g. code coverage from Codecov (
codecov.codeCoverage()) or quality metrics from SonarQube (sonarqube.metric("coverage")).
When adding static or slowly changing metadata to entities, consider adding custom data instead of custom metrics. Learn the differences
Creating a custom metric and adding data
Prerequisites
Users with the following permissions can configure custom metrics:Configure Eng Intelligence Custom Metrics- Allows for creation, editing, and deletion a custom metric definition. Editable fields include name, filter, and CQL expression. This permission also includes the ability to publish the custom metric.Manage Eng Intelligence Custom Metric data- Only required to manage custom metrics via the API. Grants access to the public API for adding and deleting data points on an API custom metric.
Creating a custom metric via CQL
Follow the steps below to create a custom metric using CQL.Cortex evaluates CQL expressions every 12 hours to check for new metric data.
- From the main sidebar, click your avatar in the bottom-left corner.
- Click Settings.
- From the Settings menu, scroll to the Workspace section, then expand Eng Intelligence.
-
Click Custom metrics.
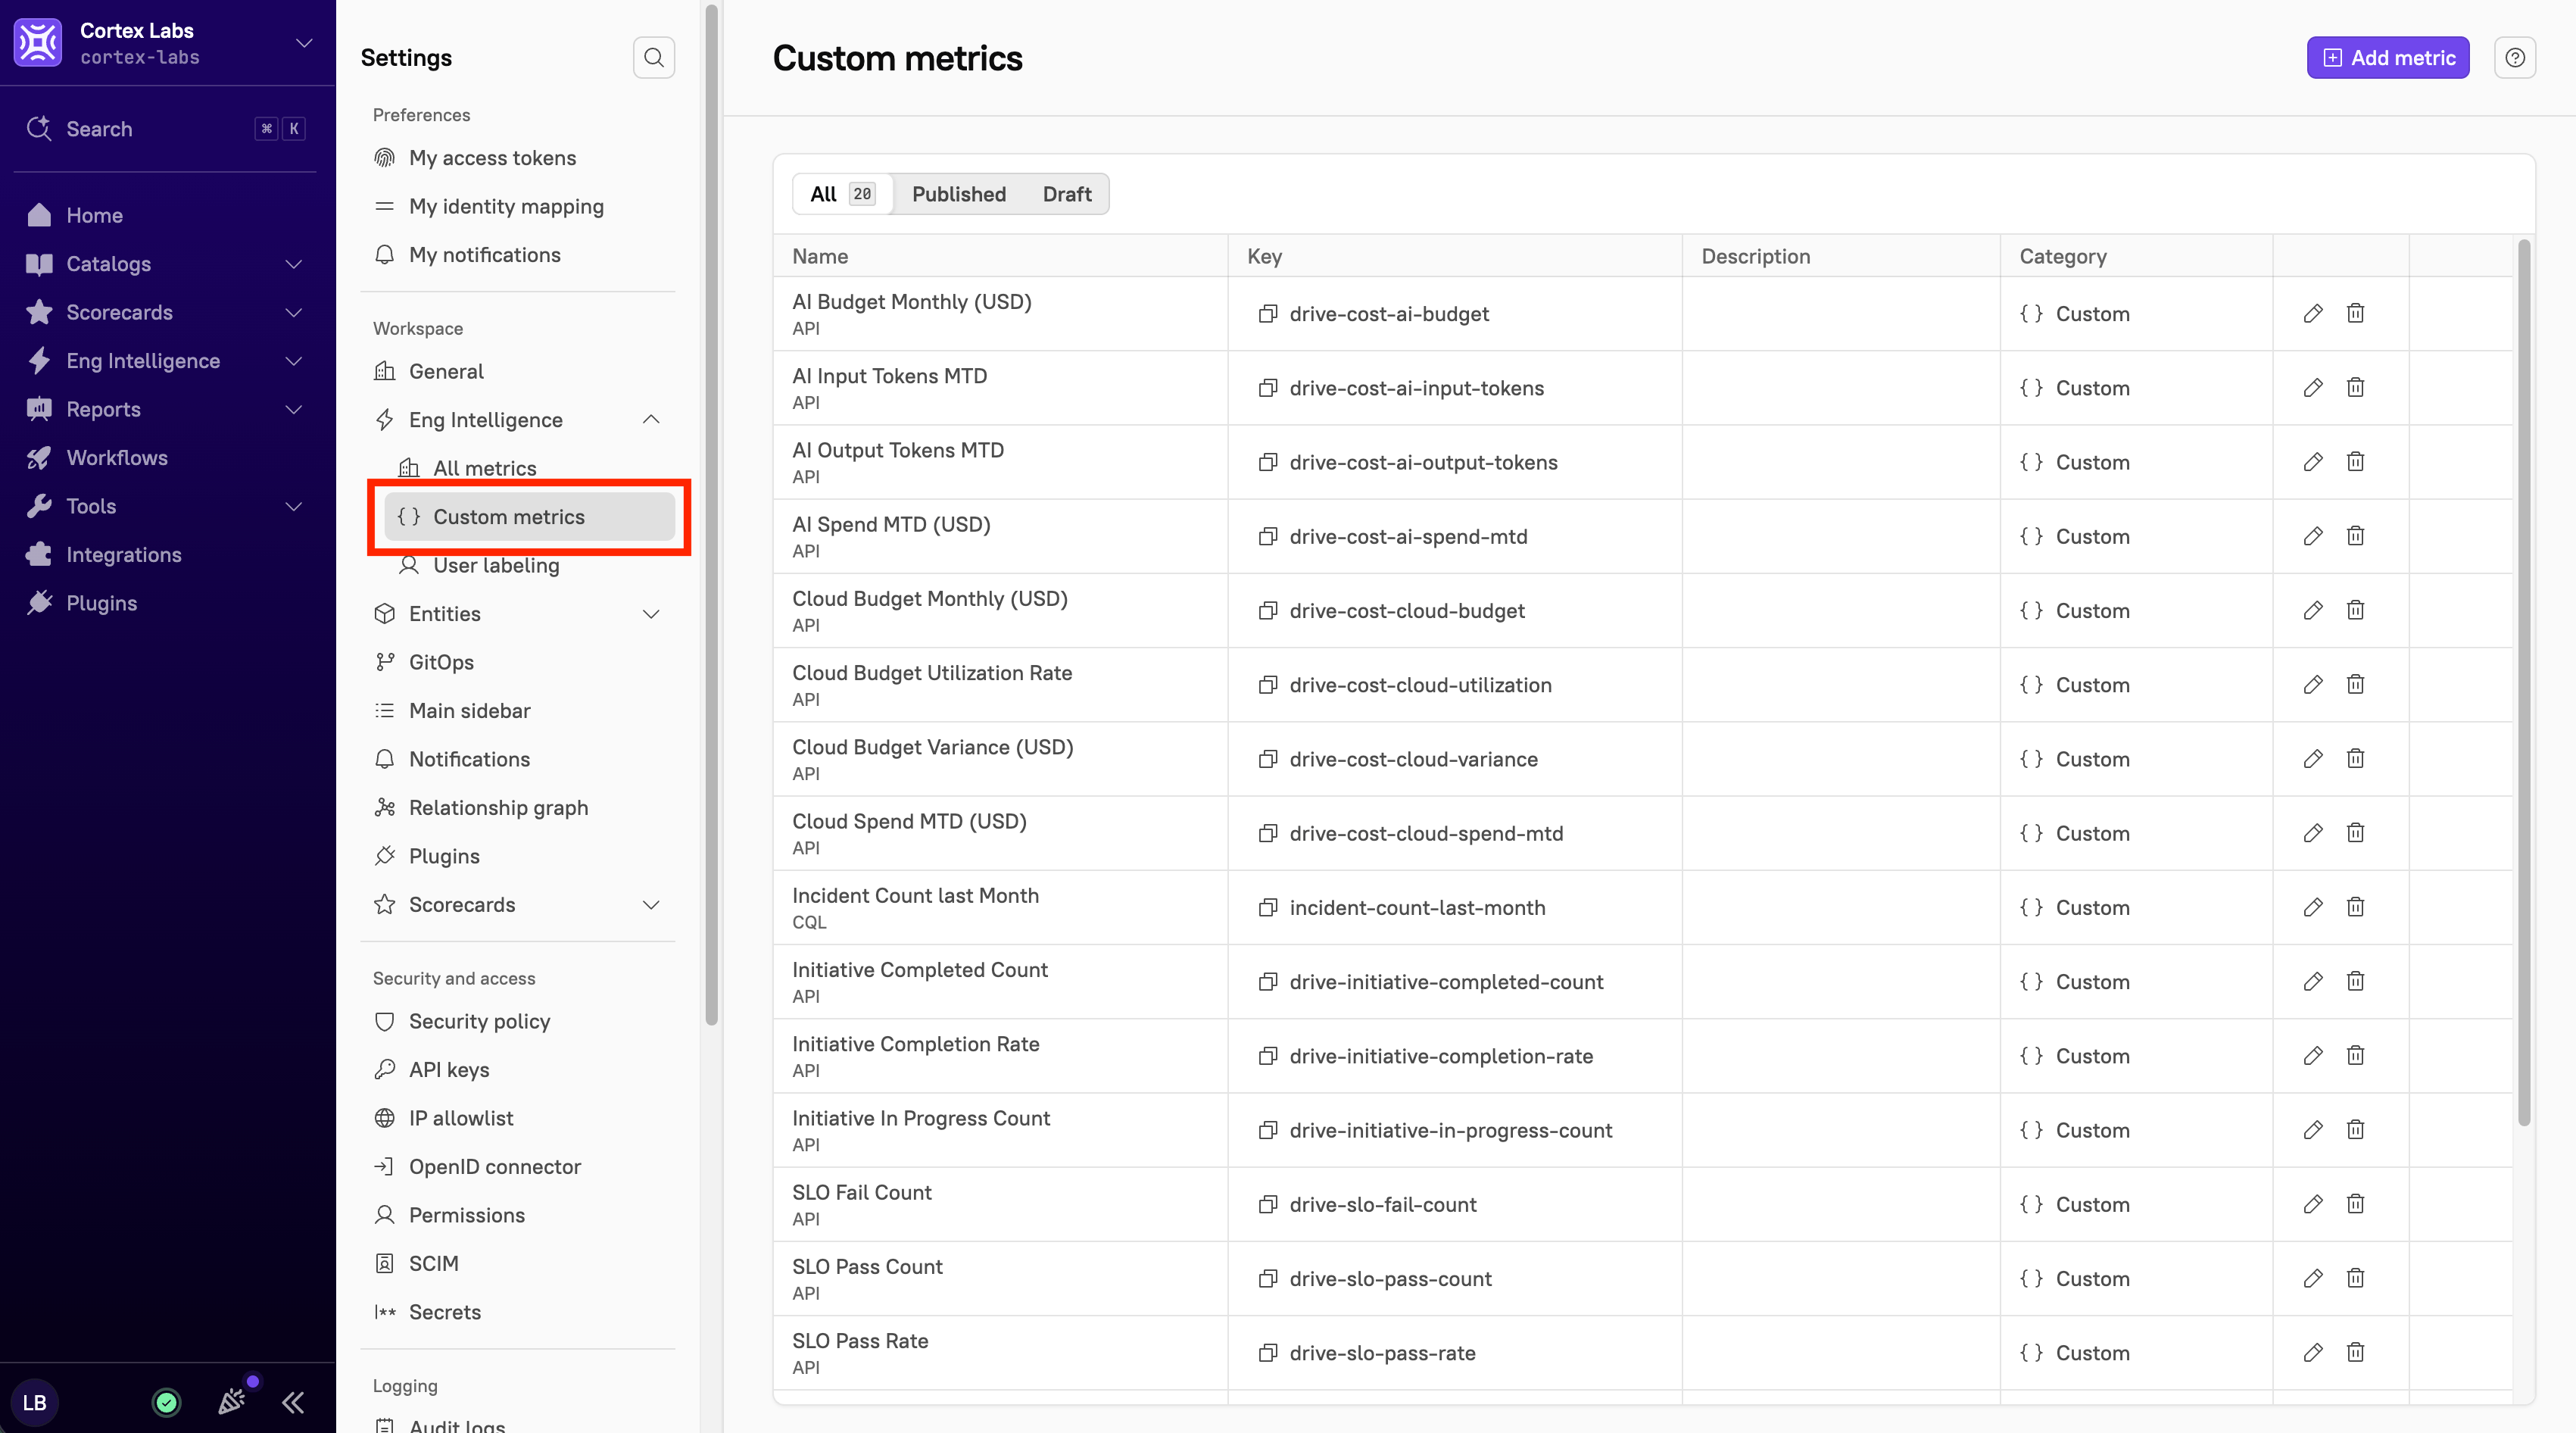
- In the upper-right corner, click Add metric.
- In the Custom metrics side panel, select the CQL radio button.
-
Under Name, enter a name for the custom metric, e.g.
pager-volume-7d(required). - Optionally, change the key. The key auto-populates based on the custom metric name and is made up of letters, digits, and hyphens.
- Under Description, enter a description of the custom metric.
- From the Category drop-down menu, assign the custom metric a category. This controls where the metric can be found for selection in Data Explorer.
- Under Trend color indicator, set an indicator to match whether higher is better or worse. This controls the color-coding of trends in Data Explorer.
- Under CQL query, click Add CQL query. In the side panel, add a CQL expression to evaluate every 12 hours. The result of the expression must be a number, otherwise validation fails. Click Save query. See Cortex Query Language (CQL) for more information.
- From the Entity types drop-down menu, choose whether to include or exclude specific entity types.
- Toggle off Draft when you’re ready to publish. By default, the custom metric is in draft state and only visible to users with the permission to configure custom metrics. Toggle this setting off to immediately enable the metric within All Metrics and Data Explorer.
- Click Add metric.
The data retention period for custom metric data is 24 months.
Results are not displayed until the end of the previous day.
Creating a custom metric via API
Follow the steps below to create a custom metric using the API.- From the main sidebar, click your avatar in the bottom-left corner.
- Click Settings.
- From the Settings menu, scroll to the Workspace section, then expand Eng Intelligence.
-
Click Custom metrics.
- In the upper-right corner, click Add metric.
- In the Custom metrics side panel, select the API radio button.
-
Under Name, enter a name for the custom metric, e.g.
pager-volume-7d(required). - Optionally, change the key. The key auto-populates based on the custom metric name and is made up of letters, digits, and hyphens.
- Under Description, enter a description of the custom metric.
- From the Category drop-down menu, assign the custom metric a category. This controls where the metric can be found for selection in Data Explorer.
- Under Trend color indicator, set an indicator to match whether higher is better or worse. This controls the color-coding of trends in Data Explorer.
- Toggle off Draft when you’re ready to publish. By default, the custom metric is in draft state and only visible to users with the permission to configure custom metrics. Toggle this setting off to immediately enable the metric within All Metrics and Data Explorer.
- Click Add metric.
The API supports backfilling custom metric data up to two (2) years.
Editing a custom metric
When editing a custom metric, note that thekey and type cannot be changed. To update either, archive the existing metric and recreate it with a new key. All other fields can be edited at any time.
Note that editing a CQL custom metric definition makes its historical values inaccessible.
To edit a custom metric:
- From the main sidebar, click your avatar in the bottom-left corner.
- Click Settings.
- From the Settings menu, scroll to the Workspace section, then expand Eng Intelligence.
-
Click Custom metrics.
-
Locate the metric you want to edit, then click the pencil icon next to it.
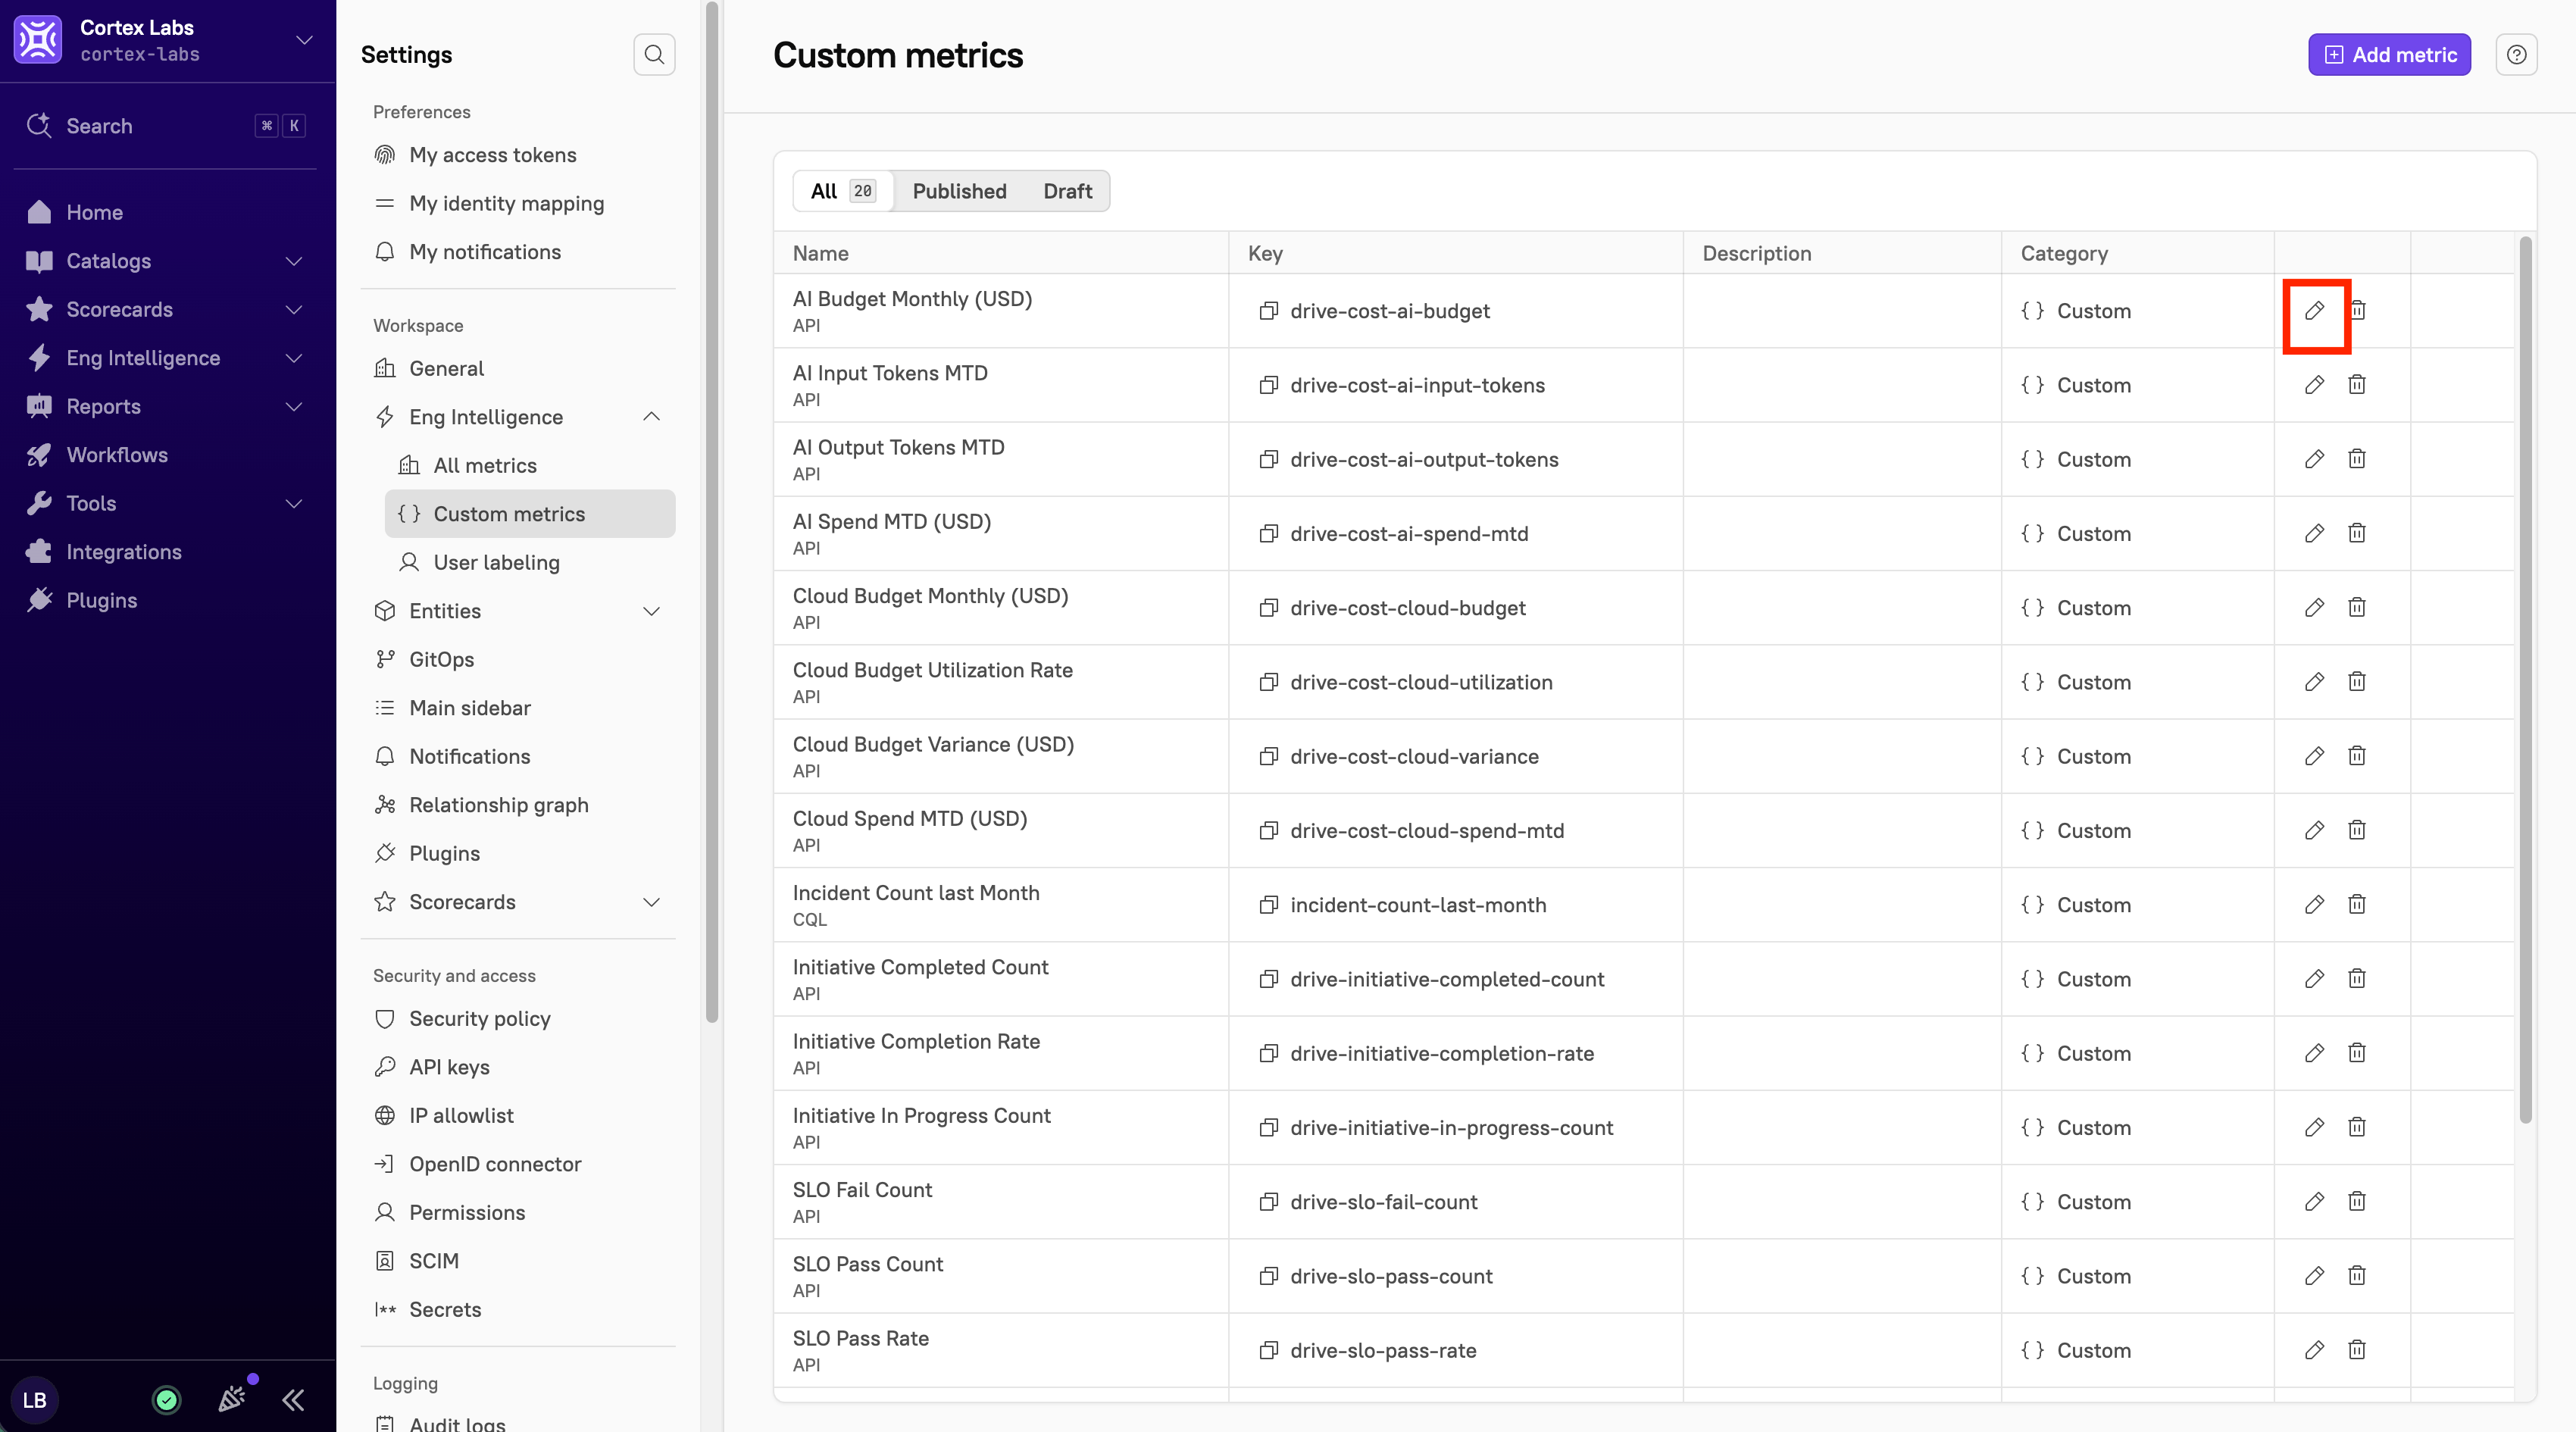
- Make any necessary changes, then click Save metric.
Viewing custom metric data
Custom metric data is available in the following areas of Cortex:- Data Explorer
- Entity details page
- All Metrics (Legacy View)
Viewing custom metric data in Data Explorer
From the main sidebar, expand Eng Intelligence, then select Data Explorer. Custom metrics appear in a list alongside other Eng Intelligence metrics.Viewing custom metric data on an entity’s details page
From an entity details page, click Custom metrics in the sidebar to view that entity’s metrics.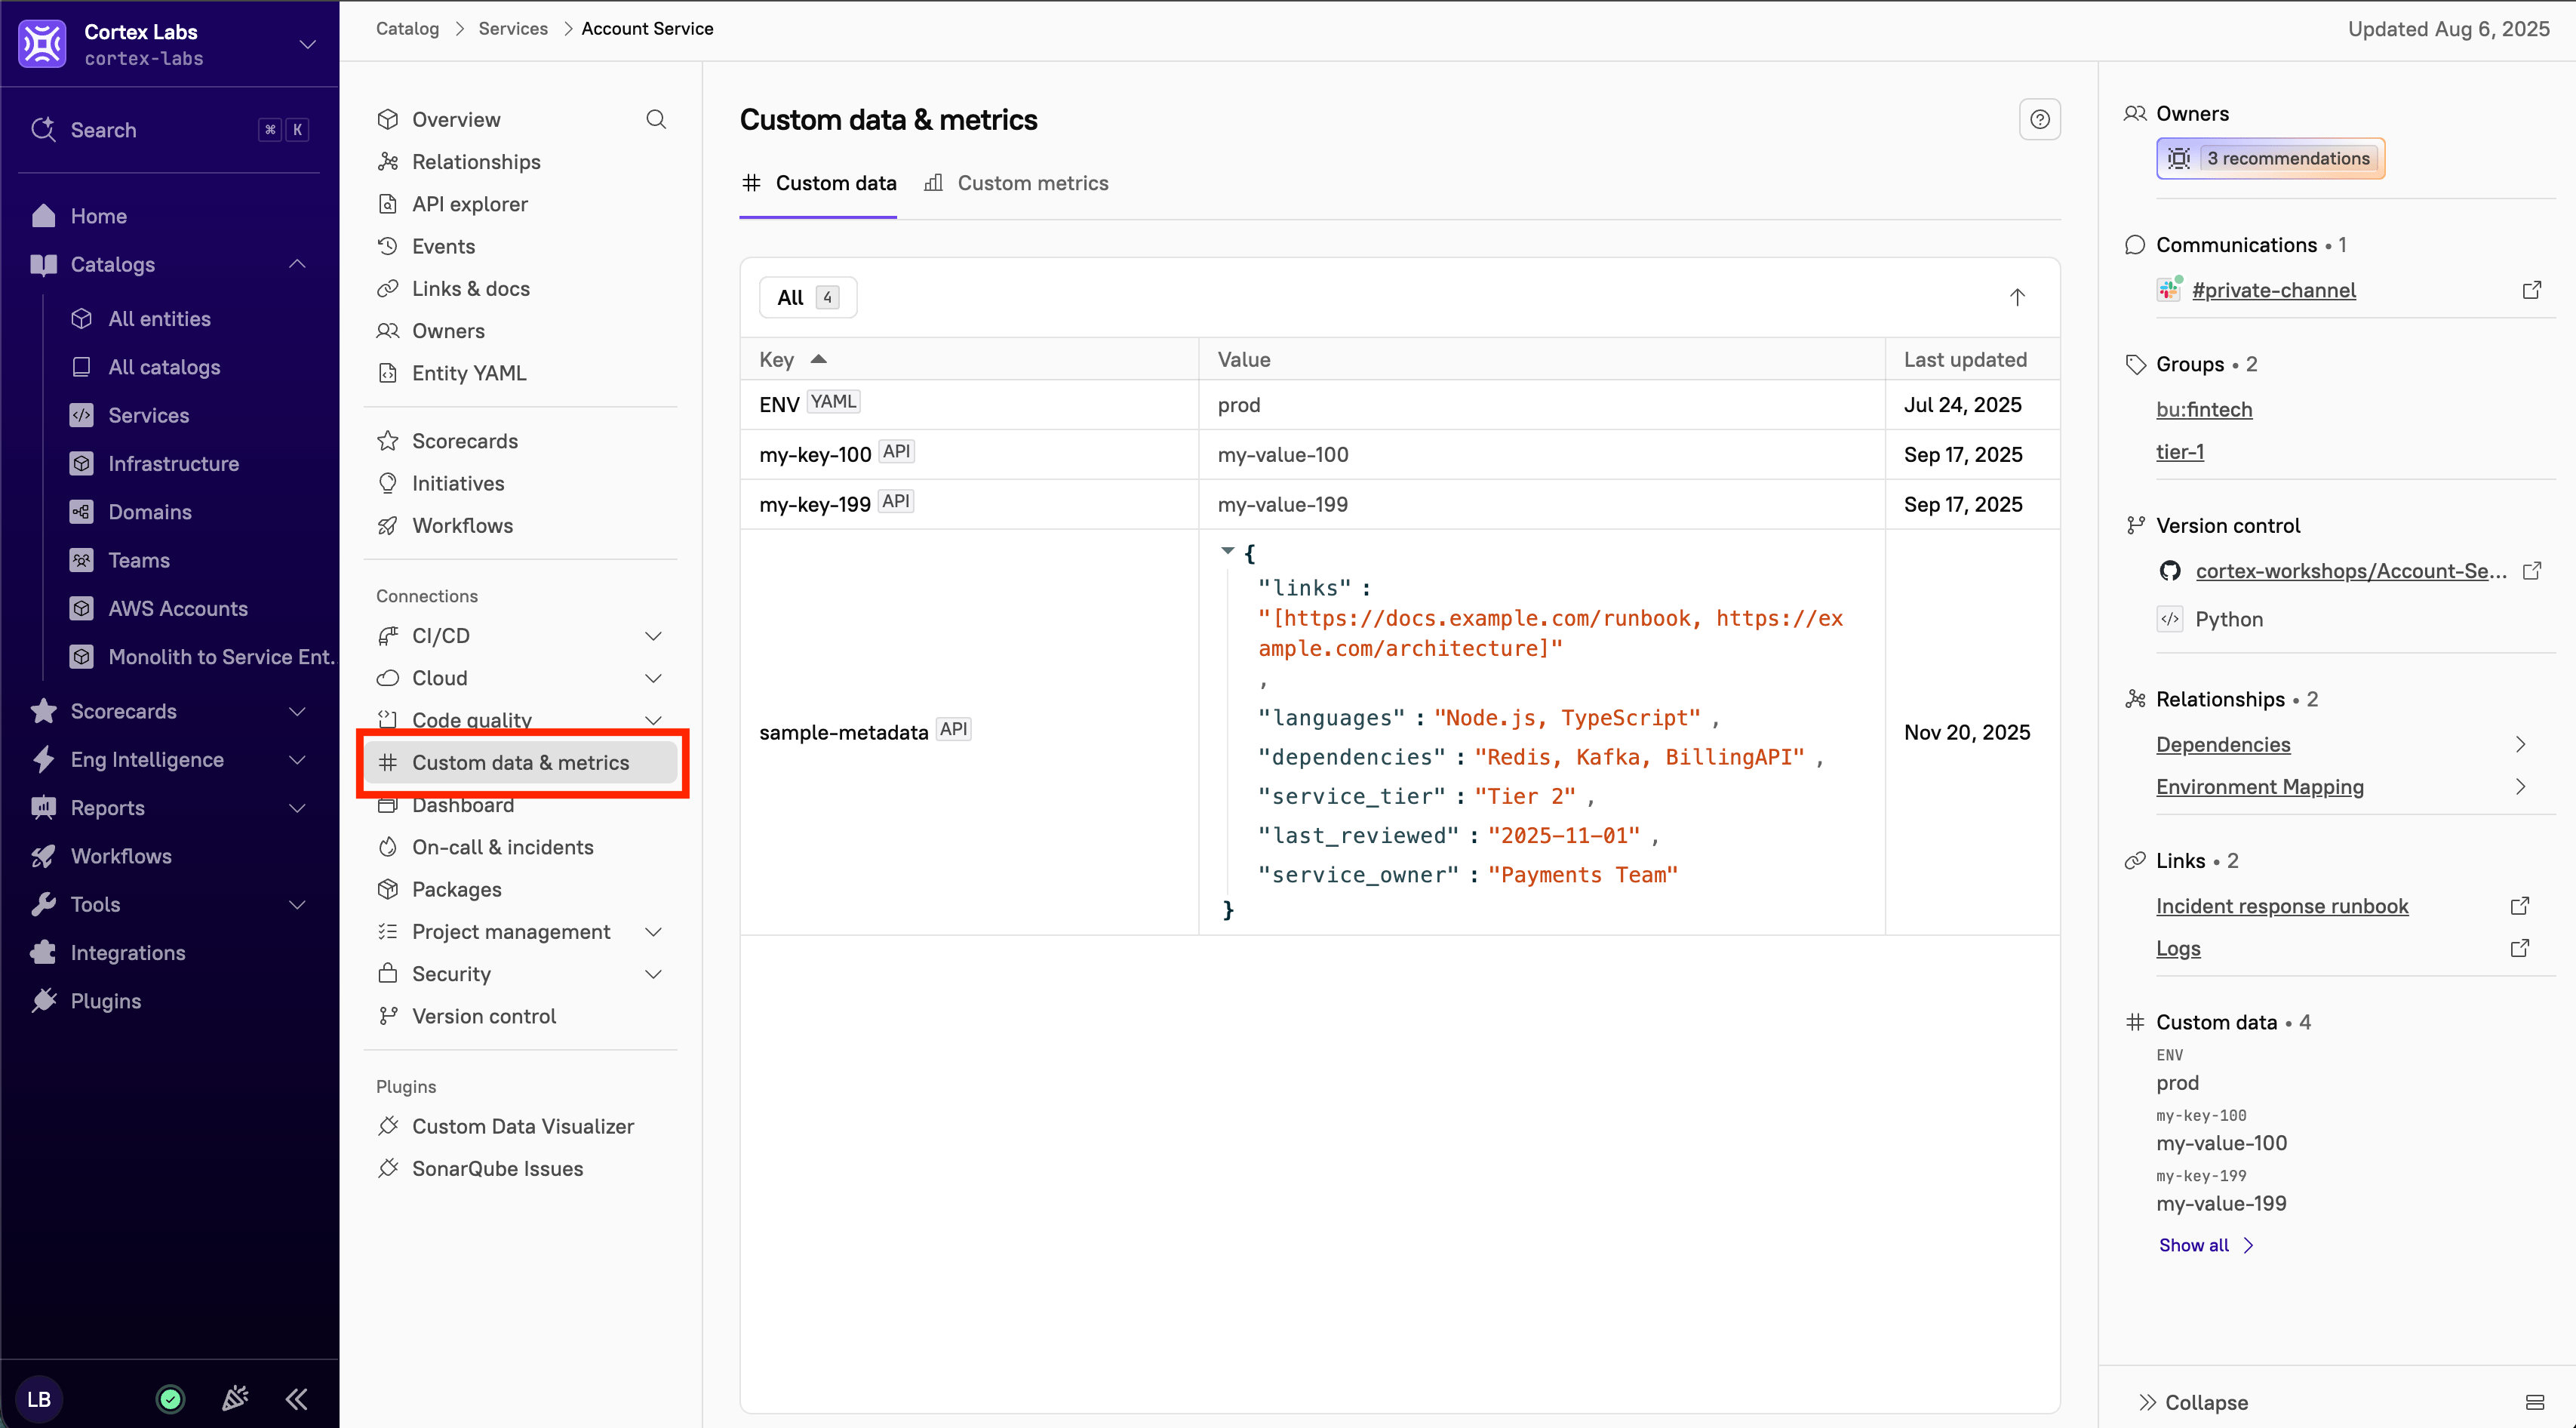
Viewing custom metric data in All Metrics (Legacy View)
From the main sidebar, expand Eng Intelligence, then select All Metrics. Custom metrics appear in a list alongside other Eng Intelligence metrics.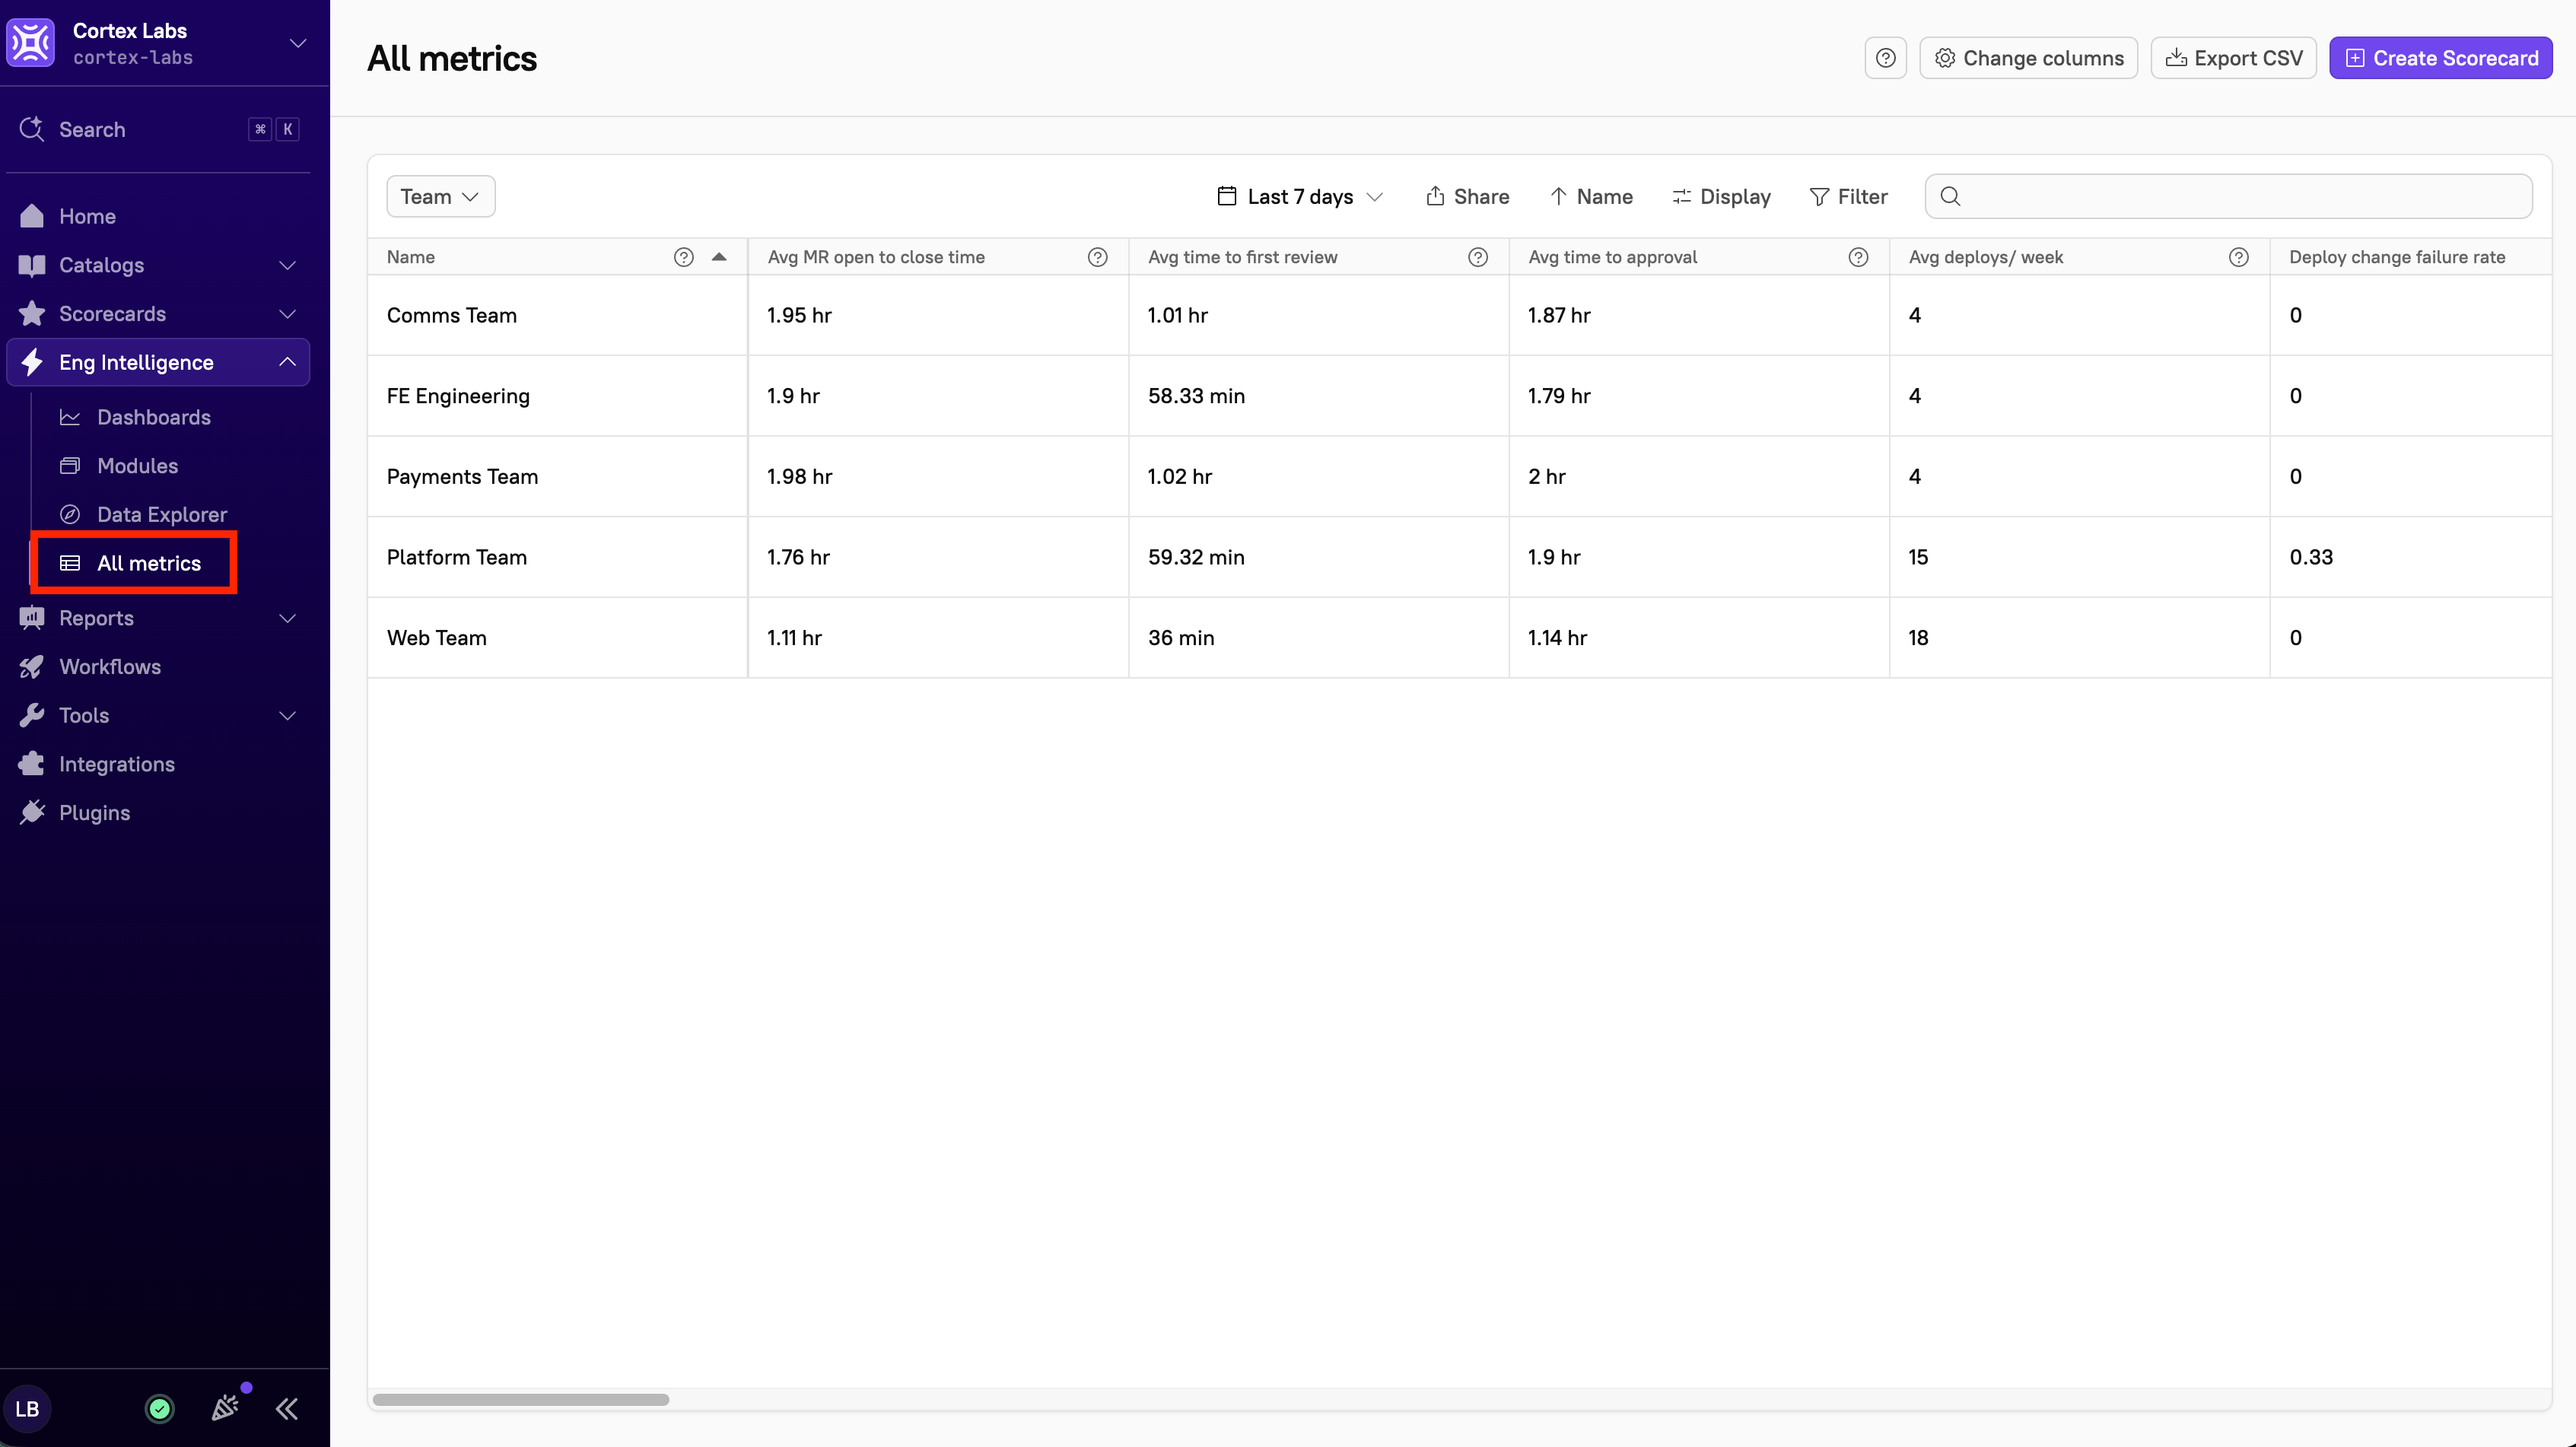
Customize your view by reordering or hiding the columns.
Querying custom metric data with CQL
Once a custom metric has data, you can query that data in CQL to build Scorecard rules and reports. ThecustomMetrics() function takes the metric’s key and a lookback window:
customMetrics(key="error-rate", lookback=duration("P30D"))
Aggregating custom metric data
customMetrics() returns a list of data points, not a list of numbers. Each data point is a record with two fields:
value- The numeric value recorded for the data point.timestamp- The date the data point was recorded.
average() and sum() only work on a list of numbers or a list of durations, so you can’t apply them to the result of customMetrics() directly. Use map() to pull the field you want into its own list first, then aggregate:
map(), the query returns the error “Could not apply average to non-numeric and non-duration element”: