Looking for additional resources on enforcing DORA standards in Cortex?
- See Solutions: DORA Metrics for guidance on using Cortex features to improve your DORA metrics.
- Check out the Cortex Academy “Operationalizing DORA Metrics” course, available to all Cortex customers and POVs.
- See Cortex’s “Operationalizing DORA Metrics” webinar with Google Cloud’s DORA program leader, Nathen Harvey, and learn about the key takeaways in our blog.
Using the DORA Dashboard
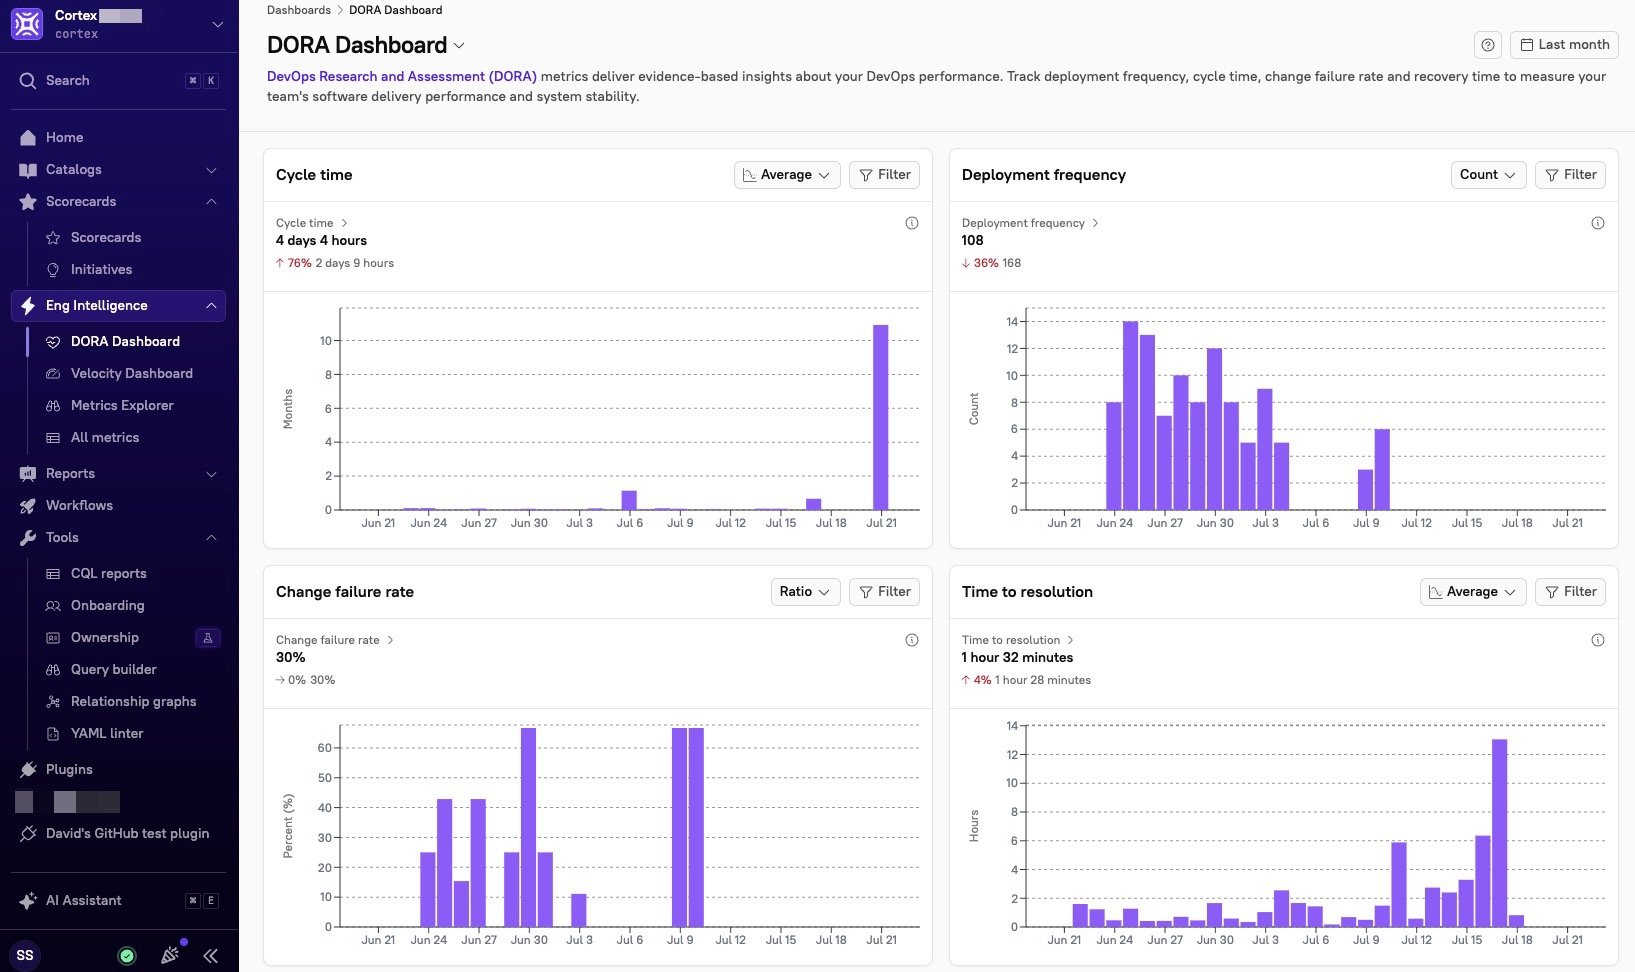
To view the dashboard, click Eng Intelligence > DORA Dashboard in the main nav.Adjust the time range
By default, the dashboard displays data from the last last month. To change the date range, click Last month and select a new date range.Filtering the DORA Dashboard
You can filter at two levels:- Dashboard level - Click Filter at the top of the DORA Dashboard to apply a filter across all charts at once. The DORA Dashboard supports Domain, Team Owner, and Team as dashboard-level filters.
- Chart level - Click Filter in the upper-right corner of an individual chart to apply filters for group, owner, repository, user label, and more. Chart-level filters override dashboard-level filters for that chart.
Metric visualizations
You can select a different operation for the Cycle time and Time to resolution graphs. Options include average, sum, max, min, P95, and median. Both graphs display the average by default.Cycle time
Cycle time represents the time it takes for a single PR to go through the entire coding process. Shorter cycle times indicate a more agile team that is able to quickly respond to changing needs. Calculation: The time between the first commit on a PR to when the PR is merged.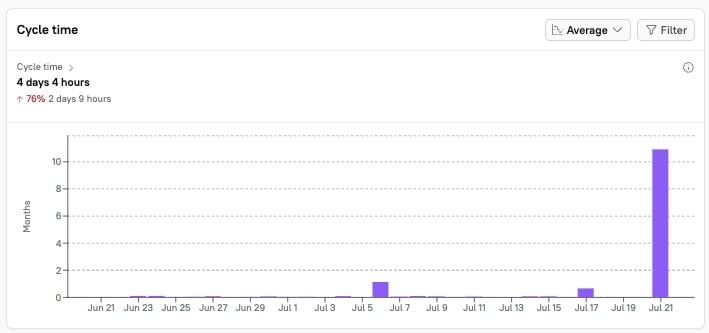
Deployment frequency
Deployment frequency measures how often your team successfully releases code to production, serving as a key indicator of your delivery velocity and operational maturity. This DORA metric reflects your team’s ability to deliver value continuously and respond quickly to market demands. Calculation: The number of deployments over a given period of time.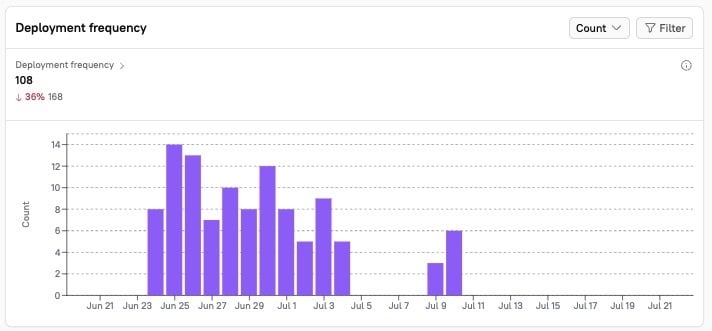
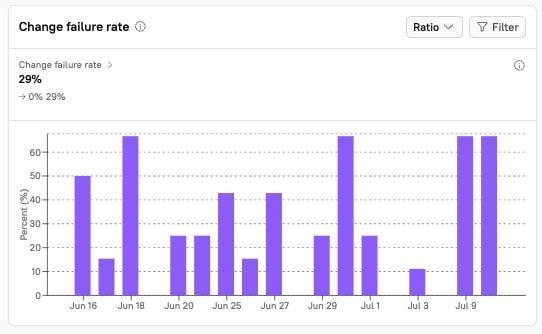
Change failure rate
Change failure rate measures the percentage of deployments that result in production failures, serving as a critical indicator of deployment stability and code quality. This DORA metric reveals how often your releases introduce bugs, outages, or performance issues that impact users. Calculation:Number of rollbacks / number of deployments created.
Time to resolution (MTTR)
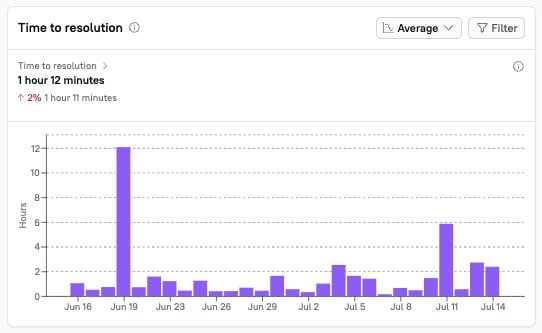
Time to resolution measures how quickly your team recovers from production failures, reflecting your incident response capabilities and system resilience. Also known as mean time to recovery (MTTR), this metric indicates how well-prepared your team is to handle inevitable production issues. Calculation:Incident resolution time - incident opened time.