> For the complete documentation index, see [llms.txt](https://docs.cortex.io/llms.txt). Markdown versions of documentation pages are available by appending `.md` to page URLs; this page is available as [Markdown](https://docs.cortex.io/improve/eng-intelligence/data-explorer/available-metrics-in-data-explorer.md).

# Available metrics in Data Explorer

{% hint style="info" %}
Note that Cortex-provided metrics in Data Explorer sync on a scheduled basis, updating every four (4) hours. [Custom metrics](/improve/eng-intelligence/custom-metrics.md) have their own sync schedules.
{% endhint %}

## Accessing metrics in Data Explorer

Follow the steps below to access metrics in Data Explorer.

1. From the main sidebar, expand **Eng Intelligence**, then select **Data Explorer**.
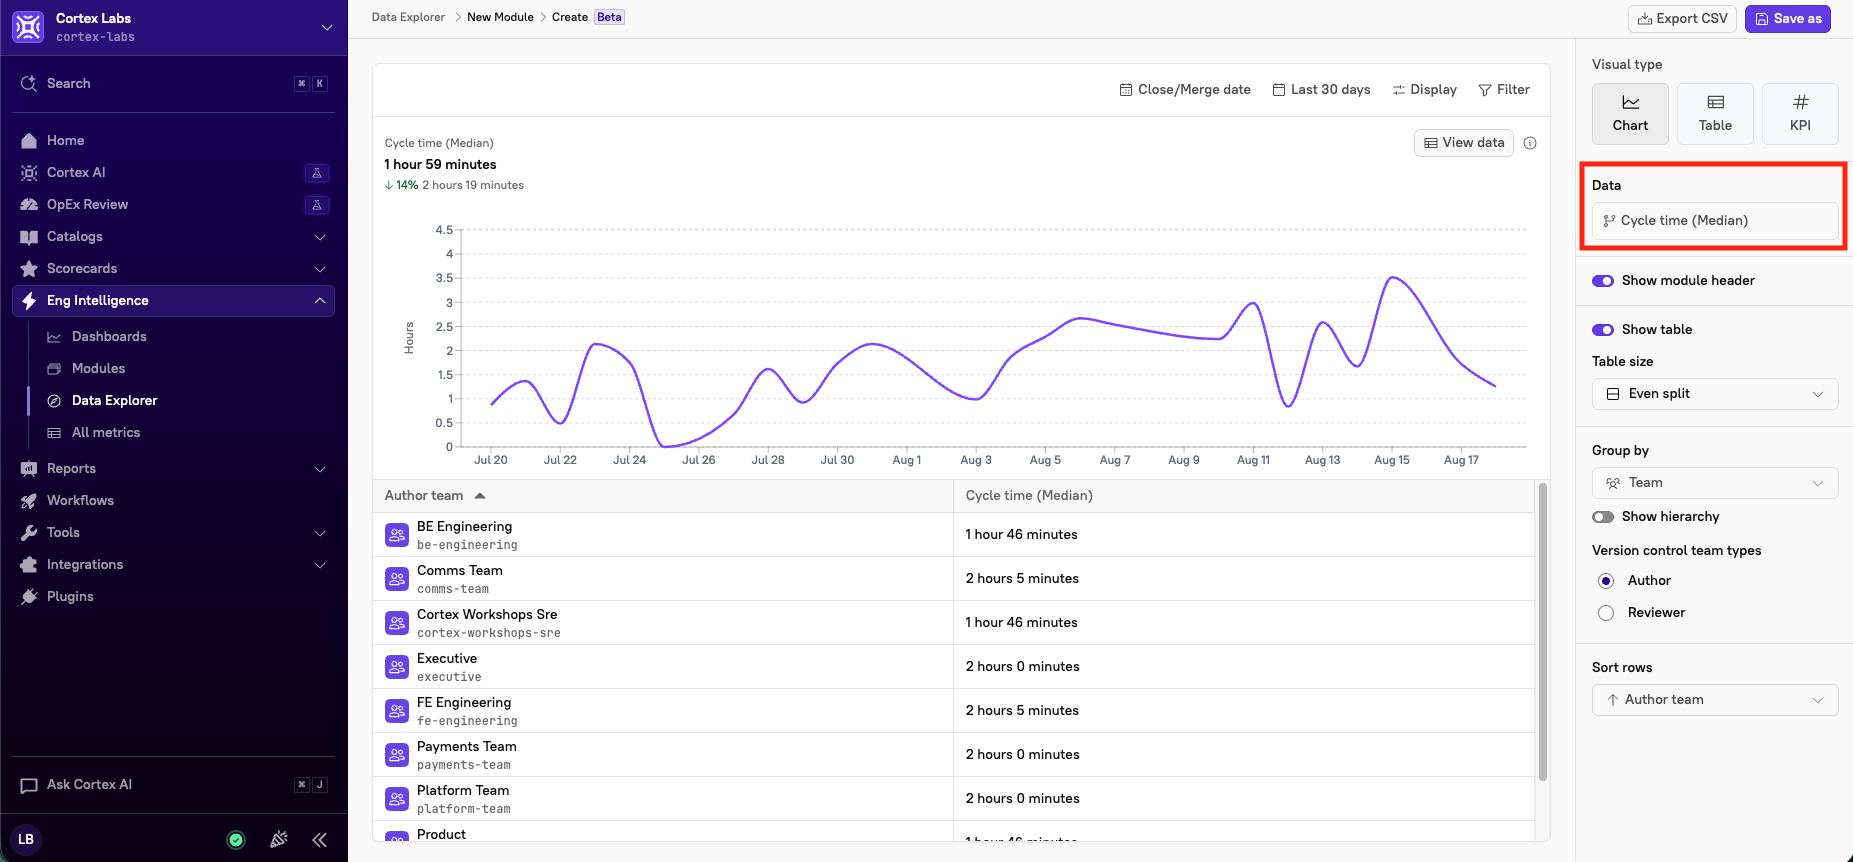
2. In the right pane, click the tab below **Data**. The **Metrics** window opens.<br>

   <div align="left" data-with-frame="true"><figure><img src="/files/AuVHP1xjt7OJ0eRUim1t" alt="The &#x27;Data&#x27; section in Data Explorer." width="375"><figcaption></figcaption></figure></div>
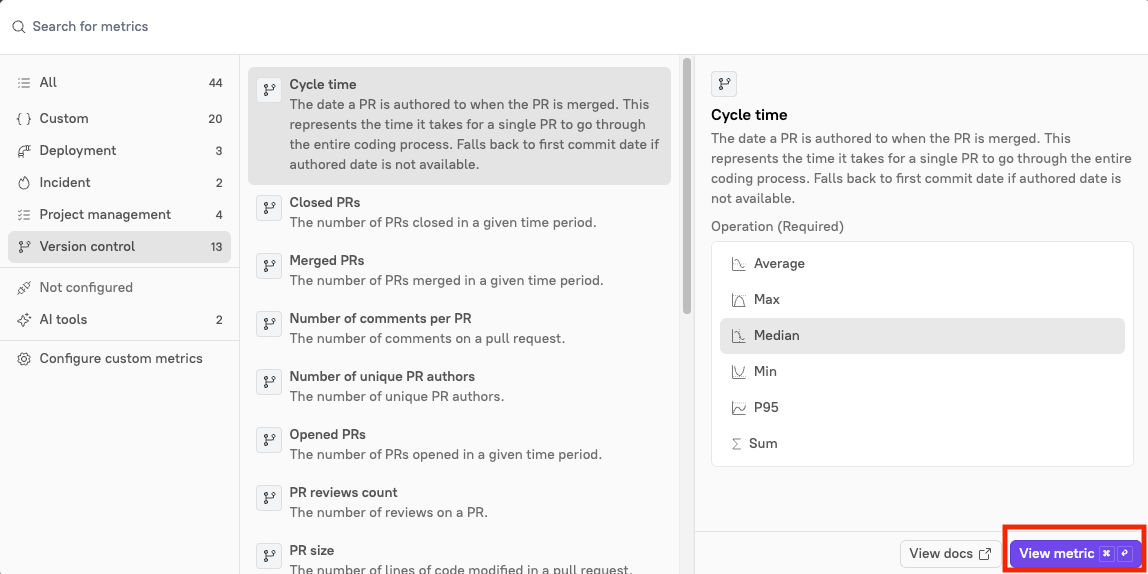
3. Select a metric to view, then click **View metric**. The chart updates automatically based on the metric you selected.<br>

   <div align="left" data-with-frame="true"><figure><img src="/files/teHIY0qWhbKdYlS44Cex" alt="The &#x27;View metric&#x27; button in the Metrics window." width="375"><figcaption></figcaption></figure></div>
4. Repeat steps 2 and 3 as necessary.

## Available metrics

### AI tools

{% hint style="info" %}
AI tool metrics are available to cloud customers in the [beta program](/resources/beta.md).
{% endhint %}

AI usage metrics are pulled from [GitHub Copilot](/ingesting-data-into-cortex/integrations/github.md).

<table><thead><tr><th width="160.75390625">Metric</th><th>Definition</th></tr></thead><tbody><tr><td><strong>AI adoption rate</strong></td><td>The percentage of licensed seats that were active users of AI coding tools in a given time period.<br><br><strong>Calculation</strong>: <code>Copilot active users / Copilot total seats</code></td></tr><tr><td><strong>Active AI users</strong></td><td>The number of users who used AI coding tools in a given time period. Cortex automatically labels users as <code>AI User</code> (active in the last 7 days) or <code>Non-AI User</code> (no Copilot activity in the last 30 days).<br><br><strong>Calculation</strong>: <code>Copilot active users</code></td></tr></tbody></table>

### Deployment metrics

Deploy metrics are pulled from the [Cortex deploys API](/api/readme/deploys.md).

<table><thead><tr><th width="210.828125">Metric</th><th>Definition</th></tr></thead><tbody><tr><td><strong>Change failure rate</strong></td><td>The percentage of deployments that cause a failure in production.<br><br><strong>Best practice</strong>: Aim to reduce your change failure rate over time. A rate below 15% aligns with DORA's elite benchmarks and indicates strong software delivery performance.<br><br><strong>Calculation</strong>: <code>Number of rollbacks / number of deployments created</code></td></tr><tr><td><strong>Deployment frequency</strong></td><td>The number of deployments over a given period of time.<br><br><strong>Best practice</strong>: Depending on your organization, a successful benchmark could be multiple deployments per day or per week.</td></tr><tr><td><strong>Rollback frequency</strong></td><td><p>The number of rollbacks over a given period of time.<br></p><p><strong>Best practice</strong>: While there isn't an explicit benchmark, you should aim to minimize rollback rates. A low rollback rate generally aligns with a low change failure rate.</p></td></tr></tbody></table>

### Incident metrics

Incident metrics are pulled from [PagerDuty](/ingesting-data-into-cortex/integrations/pagerduty.md).

<table><thead><tr><th width="190.87109375">Metric</th><th>Definition and calculation</th></tr></thead><tbody><tr><td><strong>Incident frequency</strong></td><td><p>The number of incidents over a given period of time.</p><p>When you drill in to metric points below, view data per incident:</p><ul><li>Incident title</li><li>Status</li><li>Incident URL</li><li>Date triggered</li><li>Date resolved</li><li>Urgency</li><li>Time to resolution</li></ul><p><strong>Best practice</strong>: There is no universal benchmark. It's recommended to track trends and establish baselines within your organization.</p></td></tr><tr><td><strong>Time to resolution</strong></td><td><p>The amount of time it takes for an incident to be resolved.</p><p>When you drill in to metric points, view data per incident:</p><ul><li>Incident title</li><li>Status</li><li>Incident URL</li><li>Date triggered</li><li>Date resolved</li><li>Urgency</li><li>Time to resolution</li></ul><p><strong>Best practice</strong>: Benchmarks vary by system criticality. Aim for under one (1) day for less critical systems, under 1 hour for critical ones.<br><br><strong>Calculation</strong>: <code>Incident resolution time - incident opened time</code></p></td></tr></tbody></table>

### Project management metrics

Project management metrics are pulled from [Jira](/ingesting-data-into-cortex/integrations/jira.md).

{% hint style="info" %}
Project management metrics do not support JQL entity mapping. If you configured a [default JQL query per entity](/ingesting-data-into-cortex/integrations/jira.md#set-a-default-jql-query-for-your-jira-integration), it is not applied when viewing, filtering, or segmenting these metrics in Data Explorer.
{% endhint %}

<table><thead><tr><th width="207.26953125">Metric</th><th>Definition and calculation</th></tr></thead><tbody><tr><td><strong>Story points completed</strong></td><td><p>The sum of story points completed in a given time period.</p><p>When you drill in to metric points below the graph, view data per work item:</p><ul><li>External key</li><li>Work item assignee</li><li>Assignee email</li><li>Work item title</li><li>Work item status</li><li>Work item type</li><li>Created date</li><li>Resolved date</li><li>Priority</li><li>Labels</li><li>Components</li><li>Story points completed</li></ul><p><strong>Best practice</strong>: Establish a baseline per team, as story point values can be unique to each team. Use this metric to understand capacity trends.</p></td></tr><tr><td><strong>Work item lead time</strong></td><td><p>The time it takes from when a work item is created to when the work item is completed.</p><p>When you drill in to metric points below the graph, view data per work item:</p><ul><li>External key</li><li>Work item assignee</li><li>Assignee email</li><li>Work item title</li><li>Work item status</li><li>Work item type</li><li>Created date</li><li>Resolved date</li><li>Priority</li><li>Labels</li><li>Components</li><li>Status category</li><li>Work item lead time</li></ul><p><strong>Best practice</strong>: Lower lead times indicate a smoother process. Track trends to identify process inefficiencies and improve throughput.<br><br><strong>Calculation</strong>: <code>Work item resolved date – Work item created date</code>.</p></td></tr><tr><td><strong>Work items completed</strong></td><td><p>The number of work items completed over a given period of time.</p><p>When you drill in to metric points below the graph, view data per work item:</p><ul><li>External key</li><li>Work item assignee</li><li>Assignee email</li><li>Work item title</li><li>Work item status</li><li>Work item type</li><li>Created date</li><li>Resolved date</li><li>Priority</li><li>Labels</li><li>Components</li></ul><p><strong>Best practice</strong>: Review this measure alongside how many story points have been completed; this enables you to balance both quantity and effort, ensuring teams aren't favoring lower value tasks in exchange for higher numbers of items completed.</p></td></tr><tr><td><strong>Work items created</strong></td><td><p>The number of work items created over a given period of time.</p><p>When you drill in to metric points below the graph, view data per work item:</p><ul><li>External key</li><li>Work item assignee</li><li>Assignee email</li><li>Work item title</li><li>Work item status</li><li>Work item type</li><li>Created date</li><li>Resolved date</li><li>Priority</li><li>Labels</li><li>Components</li></ul><p><strong>Best practice</strong>: Monitor this metric alongside delivery rates. If items are created faster than completed, it signals queue backlogs.</p></td></tr></tbody></table>

### Version control metrics

Version control metrics are pulled from [Azure DevOps](/ingesting-data-into-cortex/integrations/azuredevops.md), [Bitbucket](/ingesting-data-into-cortex/integrations/bitbucket.md), [GitHub](/ingesting-data-into-cortex/integrations/github.md), and [GitLab](/ingesting-data-into-cortex/integrations/gitlab.md).

{% hint style="info" %}
Pull request–related metrics include PRs from any branch.
{% endhint %}

<table><thead><tr><th width="254.53125">Metric</th><th>Definition and calculation</th></tr></thead><tbody><tr><td><strong>Cycle time</strong></td><td><p>The date a PR is authored to when the PR is merged. This represents the time it takes for a single PR to go through the entire coding process. Falls back to first commit date if authored date is not available.<br></p><p>Note: This metric is not supported for <a href="/pages/UfaVrLl3RKIMq5MfGl8t">Azure DevOps</a> or <a href="/pages/kGrYUNlQZ02lIZkLr9GB">Bitbucket</a>.<br></p><p>When you drill in to metric points below the graph, view data per PR:<br></p><ul><li>PR name</li><li>Author</li><li>PR status</li><li>First commit date</li><li>Date closed</li><li>Cycle time</li></ul><p><strong>Best practice</strong>: Aim for lower cycle times to ensure a faster feedback loop and reduced context switching. Rather than benchmarking the overall cycle time, set benchmarks for the individual parts of the cycle (time to open, time to approve, time to first review, time to merge).</p></td></tr><tr><td><strong>Closed PRs</strong></td><td><p>The number of PRs closed in a given time period.</p><p>When you drill in to metric points below the graph, view data per PR:</p><ul><li>PR name</li><li>Author</li><li>PR status</li><li>Date closed</li></ul><p><strong>Best practice</strong>: A high ratio of merged-to-closed PRs signals an effective review cycle.</p></td></tr><tr><td><strong>Merged PRs</strong></td><td><p>The number of PRs merged in a given time period.</p><p>When you drill in to metric points below the graph, view data per PR:</p><ul><li>PR name</li><li>Author</li><li>PR status</li><li>Date closed</li></ul><p><strong>Best practice</strong>: A high ratio of merged-to-closed PRs signals an effective review cycle.</p></td></tr><tr><td><strong>Number of comments per PR</strong></td><td><p>The number of comments on a pull request.</p><p>When you drill in to metric points below the graph, view data per PR:</p><ul><li>PR name</li><li>Author</li><li>PR status</li><li>First commit date</li><li>Number of comments per PR</li></ul><p><strong>Best practice</strong>: This measure indicates review depth and collaboration. A lower number may signal superficial reviews.</p></td></tr><tr><td><strong>Number of unique PR authors</strong></td><td><p>The number of unique PR authors.</p><p>When you drill in to metric points below the graph, view data per PR:</p><ul><li>PR name</li><li>Author</li><li>PR status</li><li>First commit date</li><li>Date opened</li><li><p>Time to open</p><ul><li>This is the time between the first commit date and the date opened.</li></ul></li></ul><p><strong>Best practice</strong>: A larger number across projects can signal distributed ownership, while a consistently low number can point to bottlenecks or team burnout.</p></td></tr><tr><td><strong>Opened PRs</strong></td><td><p>The number of PRs opened in a given time period.</p><p>When you drill in to metric points below the graph, view data per PR:</p><ul><li>PR name</li><li>Author</li><li>PR status</li><li>Date closed</li></ul><p><strong>Best practice</strong>: Persistent backlog can indicate process inefficiencies, such as a slow review process.</p></td></tr><tr><td><strong>PR reviews count</strong></td><td><p>The number of reviews on a PR.</p><p>When you drill in to metric points below the graph, view more data:</p><ul><li>PR name</li><li>Reviewer</li><li>Review date</li></ul><p><strong>Best practice</strong>: A higher number can indicate complex changes or low initial quality. A lower number could indicate approvals without thorough review and validation.</p></td></tr><tr><td><strong>PR size</strong></td><td><p>The number of lines of code modified in a PR.</p><p>Note: This metric is not supported for <a href="/pages/UfaVrLl3RKIMq5MfGl8t">Azure DevOps</a> or <a href="/pages/kGrYUNlQZ02lIZkLr9GB">Bitbucket</a>.</p><p>When you drill in to metric points below the graph, view data per PR:</p><ul><li>PR name</li><li>Author</li><li>PR status</li><li>Number of lines added</li><li>Number of lines deleted</li><li>PR size</li></ul><p><strong>Best practice</strong>: Smaller PRs lead to faster reviews, fewer mistakes, and increased velocity. Aim for less than 400 lines, but adjust this benchmark as needed to improve review quality and velocity.</p></td></tr><tr><td><strong>Success rate</strong></td><td><p>The percentage of PRs that are opened and eventually merged in a given time frame.</p><p>When you drill in to metric points below the graph, view data per PR:</p><ul><li>PR name</li><li>Author</li><li>PR status</li><li>Date opened</li><li>Date closed</li></ul><p><strong>Best practice</strong>: Higher success rates can indicate better quality code and reviews, but note that it is also important to understand the reasoning when a PR is rejected.</p></td></tr><tr><td><strong>Time to approve</strong></td><td><p>The time from the first review to the time it’s approved. This represents how long engineers are spending reviewing code. If the first review is an approval, this time will be 0 as the timestamps will be the same.</p><p>When you drill in to metric points below the graph, view data per PR:</p><ul><li>PR name</li><li>Author</li><li>PR status</li><li>Review date</li><li>Approval date</li><li><p>Time to approve</p><ul><li>This is the time between the review date and the approval date.</li></ul></li></ul><p><strong>Best practice</strong>: It is recommended to keep review time under 24 hours to maintain velocity and avoid a backlog of PRs.</p></td></tr><tr><td><strong>Time to first review</strong></td><td><p>The time a PR is open to when the PR gets it’s first review (comment or approval). This represents how long PRs are waiting idol before someone starts reviewing it.</p><p>When you drill in to metric points below the graph, view data per PR.</p><ul><li>PR name</li><li>Author</li><li>PR status</li><li>Date opened</li><li>First review time</li><li><p>Time to first review</p><ul><li>This is the time between the open date and the first review time.</li></ul></li></ul><p><strong>Best practice</strong>: It is recommended to target first review within 24 hours to ensure prompt feedback and smooth throughout.</p></td></tr><tr><td><strong>Time to merge</strong></td><td><p>The time from when the PR is approved to when it’s merged.</p><p>When you drill in to metric points below the graph, view data per PR:</p><ul><li>PR name</li><li>Author</li><li>PR status</li><li>Approval date</li><li>Date closed</li><li><p>Time to merge</p><ul><li>This is the time between the approval date and the date closed.</li></ul></li></ul><p><strong>Best practice</strong>: There is not an explicit benchmark for this metric, but note that reducing this time to under an hour boosts code velocity. Using a tool that enforces automated merges can cut down delays.</p></td></tr><tr><td><strong>Time to open</strong></td><td><p>The date a PR is authored to when the PR is opened. This represents the time spent coding. Falls back to first commit date if authored date is not available.</p><p>Note: This metric is not supported for <a href="/pages/UfaVrLl3RKIMq5MfGl8t">Azure DevOps</a> or <a href="/pages/kGrYUNlQZ02lIZkLr9GB">Bitbucket</a>.</p><p>When you drill in to metric points below the graph, view data per PR:</p><ul><li>PR name</li><li>Author</li><li>PR status</li><li>First commit date</li><li>Date opened</li><li><p>Time to open</p><ul><li>This is the time between the first commit date and the date opened.</li></ul></li></ul><p><strong>Best practice</strong>: There is not an explicit benchmark for this metric, but note that increasing the time to open depends on an efficient triage of work; focus on minimizing idle time before work starts.</p></td></tr></tbody></table>

### Custom metrics

You can view [custom metrics](/improve/eng-intelligence/custom-metrics.md) in Data Explorer alongside Cortex's out-of-the-box metrics, appearing in the category selected at creation. Custom metrics are displayed as raw numeric values and can be aggregated using the following operations: average, max, median, min, p95, and sum.