> For the complete documentation index, see [llms.txt](https://docs.cortex.io/llms.txt). Markdown versions of documentation pages are available by appending `.md` to page URLs; this page is available as [Markdown](https://docs.cortex.io/ingesting-data-into-cortex/integrations/datadog/using-the-integration-for-datadog.md).
# Using the integration for Datadog
{% hint style="info" %}
Cortex connects to many third-party vendors whose system interfaces frequently change. As a result, integration behavior or configuration steps may shift without notice. If you encounter unexpected issues, check with your system administrator or refer to the vendor's documentation for the most current information. Additionally, integration sync times vary and are subject to scheduling overrides and timing variance.
{% endhint %}
This article explains how to use the integration for Datadog. For configuration instructions, see [Configuring the integration for Datadog](/ingesting-data-into-cortex/integrations/datadog.md). For instructions on connecting Datadog to entities, see [Connecting entities to Datadog](/ingesting-data-into-cortex/integrations/datadog/connecting-entities-to-datadog.md).
## **Viewing monitors and SLOs on an entity's details page**
High-level information about monitors and service level objectives (SLOs) appears in the **Overview** tab on an entity's details page:
To drill into the data, locate **Connections** in the left details sidebar, expand **Observability**, then select Datadog.
The Datadog Monitoring page opens. Select a tab to view the following:
* **All** - Shows both monitors and SLOs.
* **Monitors** - Shows the title for each monitor, its query (if available), and its status.
* **SLOs** - Shows each SLO for the entity: its targets, current value, status, and the time period it's calculated over. For example, "7 days ago" means the SLO covers the range from 7 days ago to now.
Click any monitor or SLO block to open Datadog, where you can dig further into the data.
### Discovery audit
Cortex pulls recent changes from your Datadog environment into the [discovered entities list](/ingesting-data-into-cortex/entities-overview/entities/discovery-audit.md). Here, you can find new entities in Datadog that have not been imported into your Cortex catalog. These entities have the **New APM Resource** tag. You'll also find entities in the catalog that no longer exist in Datadog. These have the **APM Resource Not Detected** tag.
## Viewing incident data
### Incident list
You can view incident data in the incident list and on an [entity's details page](https://docs.cortex.io/ingesting-data-into-cortex/entities-overview/entities/details).
{% hint style="info" %}
The incident list is in Public Beta.
{% endhint %}
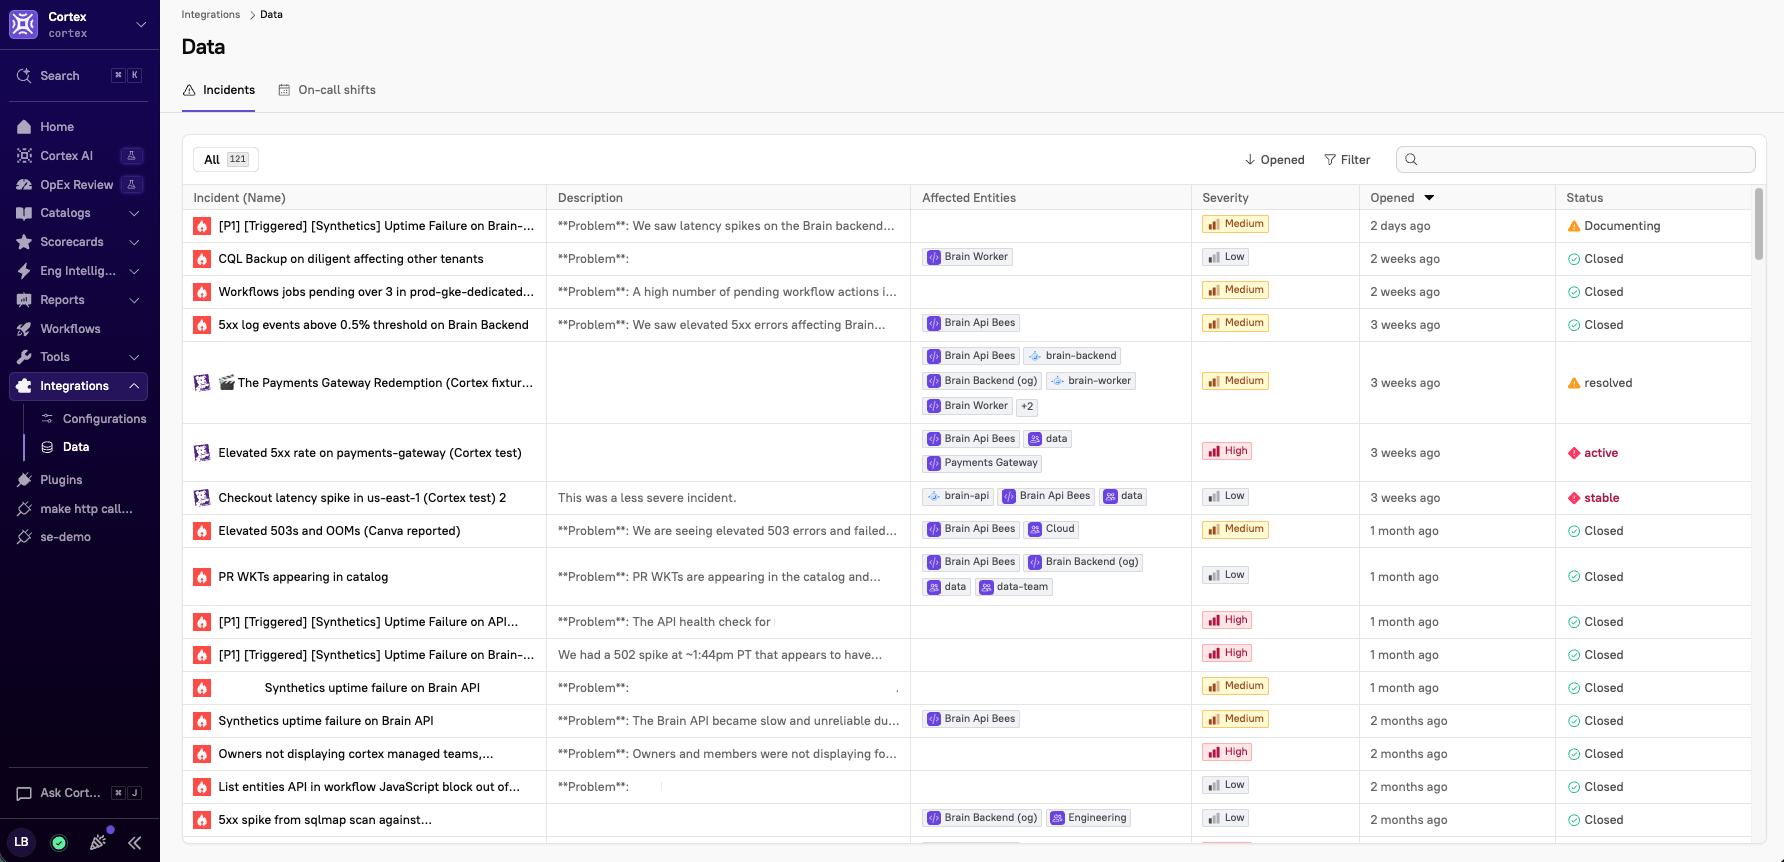
See every incident across your organization in one place, with metadata including severity, status, and affected entities.
**To access the incident list**:
1. From the main sidebar, expand **Integrations**, then select **Data**.
2. Select the **Incidents** tab.
The list is sorted by most recently opened incidents first.
#### **Searching across and filtering the incident list**
There are several ways to search and filter the list:
* To find specific incidents, use the search bar in the upper-right corner of the page and type to search.
* By default, the list sorts by most recently opened incident. Click **Opened** to reverse the order, or click **Name** to sort alphabetically instead.
* Click **Filter** to narrow down your list by date range, severity level, or status.
### Incidents on an entity's details page
View incidents in the following places on an entity's details page:
* On the **Overview** tab; active incidents are prominently displayed at the top of the page
* In the left details sidebar, locate **Connections**, then select **Incidents**
## Viewing on-call information
{% hint style="info" %}
Datadog On-Call is in Public Beta.
{% endhint %}
### On-call shift data
View all on-call shifts ingested via the Datadog integration in a single place. This allows you to see exactly what data Cortex has brought in from the integration and what entities it's been linked to within Cortex.
**To access the on-call list**:
1. From the main sidebar, expand **Integrations**, then select **Data**.
2. Select the **On-call shifts** tab.
3. Do one of the following:
* Select the **All** tab to view all on-call shifts in your workspace.
* Select the **Mine** tab to view only your on-call shifts.
The list is sorted alphabetically by schedule name. Click a row to open a side panel showing who's on call now, who's on call next, and the teams the schedule is associated with.
#### **Searching across and sorting the on-call list**
To search and sort the list:
* Use the search bar in the upper-right corner of the page and type to search.
* By default, the list sorts alphabetically by schedule name. Click **Name** to sort from Z to A.
### On-call on an entity's details pages
View current on-call information in the following places on an entity's details page:
* In the metadata sidebar in the **On-call now** block
* In the left details sidebar, locate **Connections**, then select **On-call**
* Click a row to open a side panel showing who's on call now, who's on call next, and the teams the schedule is associated with.
### Engineering homepage
View upcoming on-call rotations in the **My on-calls** block on your engineering homepage. Cortex shows on-call schedules up to six months out.
## Creating Scorecard rules with Datadog data
Cortex Query Language (CQL) lets you write Scorecard rules and queries against Datadog data, including:
* Metrics
* Monitors
* SLOs
* Incidents
* Common Scorecard rules include:
* Ensure services have had no critical incidents in the past 30 days
* Verify mean time to resolution meets your SLOs
* On-call
* Common Scorecard rules include:
* Verify that all production services have an on-call schedule configured
* Ensure critical services have on-call coverage before go-live
For more information, including example queries, refer to the [in-app Datadog CQL documentation](https://app.getcortexapp.com/admin/cql-explorer?path=CQL%20explorer\&path=Integrations\&path=Datadog).
## Incident metrics in Eng Intelligence
{% hint style="info" %}
Incident metrics in Eng Intelligence is in Public Beta.
{% endhint %}
Incident metrics in [Eng Intelligence](https://docs.cortex.io/improve/eng-intelligence) are powered by the same unified data pipeline as the incident list, so the numbers stay consistent across Cortex. Eng Intelligence supports the following incident metrics:
* Incident frequency
* Mean time to resolution (MTTR)
## Syncing data from Datadog
Cortex syncs data from Datadog as follows:
* **Monitors and SLOs** - Cortex syncs Datadog monitor and SLO data on a background schedule, so values in Cortex may lag live Datadog by up to 30 minutes.
* **Dependencies** - The dependency sync runs automatically each day at 12 a.m. UTC, and can be run manually via the [Sync dependencies button](/ingesting-data-into-cortex/entities-overview/entities/adding-entities/dependencies.md#sync-dependencies) in the relationship graph.
* **Incident data** - Cortex syncs incident data from Datadog every 15 minutes.
Because Datadog does not support sorting incidents by last-modified date, Cortex refreshes the full incident set on each sync rather than fetching only what changed. Edits to older incidents are picked up on the next full refresh.
* **Schedule and shift data** - Cortex syncs schedule and shift data from Datadog every 30 minutes. Because Datadog schedules do not expose a last-modified timestamp, Cortex refreshes the full schedule set on each sync rather than fetching only what changed.
## Viewing Datadog integration logs
{% hint style="info" %}
This feature is available in Cortex cloud.
{% endhint %}
While viewing an integration's settings page, select the **Logs** tab to view error logs from the last 7 days. You can filter the logs list by configuration and by operation (for example, you could filter to view errors surfaced only via Scorecards).
Click into a row to get more information, including time stamp, status code, full error, and request path.
## Troubleshooting and FAQ
**Monitoring**
Can I set a Scorecard rule to monitor Datadog monitors/SLOs based on tags?
Yes, you can specify key-value pairs that allow Cortex to discover your SLOs and monitors, and use these tags in Scorecard rules.
**Dependency**
How does Datadog work with other dependency sources?
When leveraging multiple dependency sources such as Datadog and a catalog entity's YAML, all the sources would be merged together and Cortex will de-duplicate the dependencies.
For example, if an entity YAML indicates `X → Y` and Datadog indicates `X → Y` and `X → Z`, the entity will display two edges presented as `X → Y` and `X → Z`.
**On-call**
I connected Datadog but no on-call data appears on my entity.
On-call requires an explicit registration. Confirm the entity has a `SCHEDULE` or `TEAM` registration, either in the on-call editor or in the entity descriptor, and that the ID matches the one in the Datadog URL.
I registered a team but see no schedules.
A `TEAM` registration maps every schedule that carries that team in Datadog. If the team has no schedules attached, nothing will map. Register the schedule directly instead.
Why does my schedule show a different person than the rotation says?
Overrides in Datadog take precedence. Cortex shows the effective on-call person for the current shift.
A responder appears twice in the participant list.
This is expected when a user is a member of more than one layer on the same schedule.