The relationship graph gives you a visual map of your Cortex catalog. Instead of reading dependencies, ownership, and architecture out of individual entity pages, you can see how everything connects in one interactive diagram. Use it to understand three different views of your organization:
- Dependencies - Visualize how entities depend on one another. You can also sync dependencies directly from the graph.
- Domains - See a hierarchical diagram of your software architecture.
- Teams - View your company’s team structure and how teams nest within one another.
Viewing the relationship graph
To access the relationship graph, expand Tools in the main sidebar, then click Relationship graphs. By default, the page loads the view you’ve set as your default (Dependencies, Domains, or Teams) and shows all entities in that view along with their connections.
Use the toolbar controls to move around the large graph:
- Use the zoom controls in the bottom-left corner to zoom in and out, fit the graph to the screen, or lock the view in place. If your mouse has a scroll wheel, you can also scroll to zoom in and out.
- Use the mini-map in the bottom-right corner to orient yourself and jump to another part of the graph.
Choosing a relationship type
At the top-left of the page, use the view drop-down menu to switch between the three relationship types: Dependencies, Domains, and Teams. The available filters and display options change depending on which type you’re viewing.
Dependencies
Visualize how entities relate to one another:
Domains
See a hierarchical diagram of your software architecture:
Teams
View your org’s team structure:
Searching and filtering the graph
Searching
Use the search bar at the top of the page to find and focus a single entity. Start typing an entity’s name, then select it to center the graph on that entity and its connections.
Filtering
If your graph has more than 500 nodes, you must apply a filter before the graph displays.
- Sources - Limit the graph to entities from specific data sources.
- Groups - Limit the graph to entities in specific groups.
- Entity types - Limit the graph to specific entity types.
- Degrees from selected node - This is unlocked when you select an entity node. Once you’ve selected an entity node, set how many connection hops out from that entity to display.
The graph applies your selections and reloads automatically. Click Reset display to clear all filters.
Choosing display options
Click Display options in the upper-right corner of the page to control how the graph is drawn. The options depend on which relationship type you’re viewing.
In the Dependencies view:
- Show entity type icons - Show or hide the icon on each node.
- Show nodes without dependencies - Show or hide entities that have no dependencies.
- Scorecard - Select a Scorecard to color and evaluate the graph against.
In the Domains view:
- Show domain nodes without children - Show or hide domains that contain no entities.
- Show archived entities - Include or exclude archived entities.
- Scorecard - Select a Scorecard to color and evaluate the graph against.
In the Teams view:
- Show team nodes without children - Show or hide teams that have no members or child teams.
- Show archived entities - Include or exclude archived entities.
- Scorecard - Select a Scorecard to color and evaluate the graph against.
Click Reset display to return to the default display options.
Inspecting an entity
Click any node in the graph to open a quick-actions popup for that entity, where you can:
- Filter by this node - Refocus the graph on the selected entity. This also enables the Degrees from selected node filter so you can expand or contract how much of its network is shown.
- Go to entity - Open the entity’s details page.
If the entity has dependencies or child entities, the popup also lists them. Click any item in the list to open that entity.
Sharing or syncing from the graph
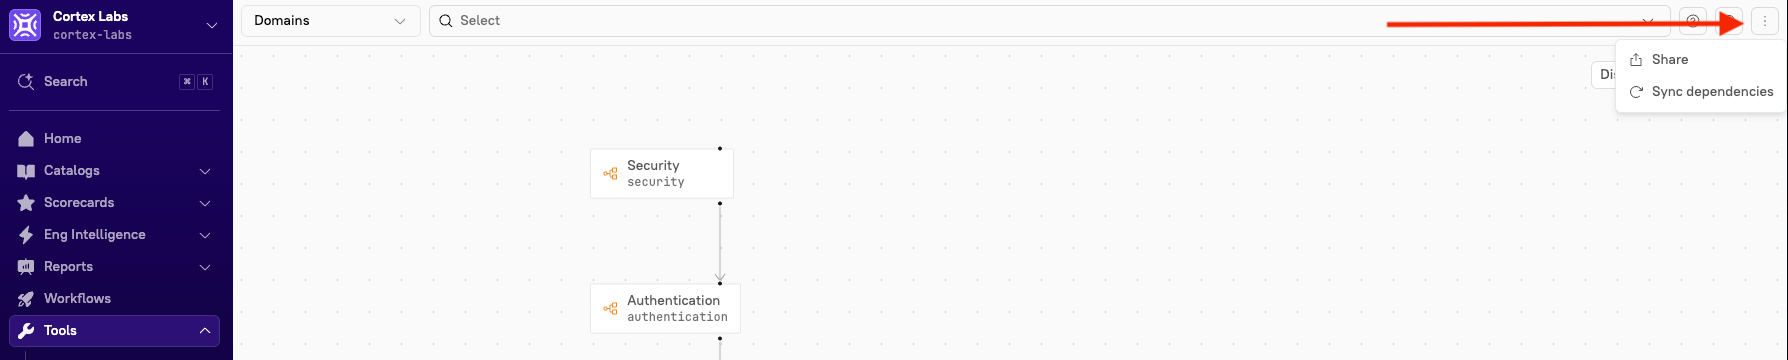
Click the overflow menu icon in the upper-right corner of the page to:
- Share - Share the current graph view.
- Sync dependencies - Users with the
Enable Entity Dependency Discovery permission can manually sync dependencies. Cortex automatically syncs AWS dependencies every day at 8:00 a.m. UTC. All other dependencies sync at 12:00 a.m. UTC.
Setting the default view
Users with the Configure Settings permission can set the default view of the relationship graph.
- From the main sidebar, click your avatar in the bottom-left corner.
- Click Settings.
- From the Settings menu, locate the Workspace section, then click Relationship graph.
- Under Select view, choose which view (Dependencies, Domains, or Teams) opens by default when you navigate to the relationship graph.
Last modified on September 21, 2026